Forex traders use the OBV indicator for determining the total volume of a day, assigning positive and negative values depending on the price closure point in comparison to the preceding day. A positive volume occurs if the closing point is higher and if it is lower, the volume is said to be negative.
The precise value of OBV does not hold much importance as its direction with respect to the market price. It is assumed that changes in OBV are followed by shifts in price. So, when both the price and OBV are rising, a bullish divergence is likely to follow, and when the price is rising and OBV is falling, a bearish divergence is a likely implication.
A falling OBV and falling price lead to a bearish confirmation, while the converse leads to a bullish divergence. On the other hand, a non-confirmation occurs when the pair’s price shift occurs before the OBV change.
- Simple OBV
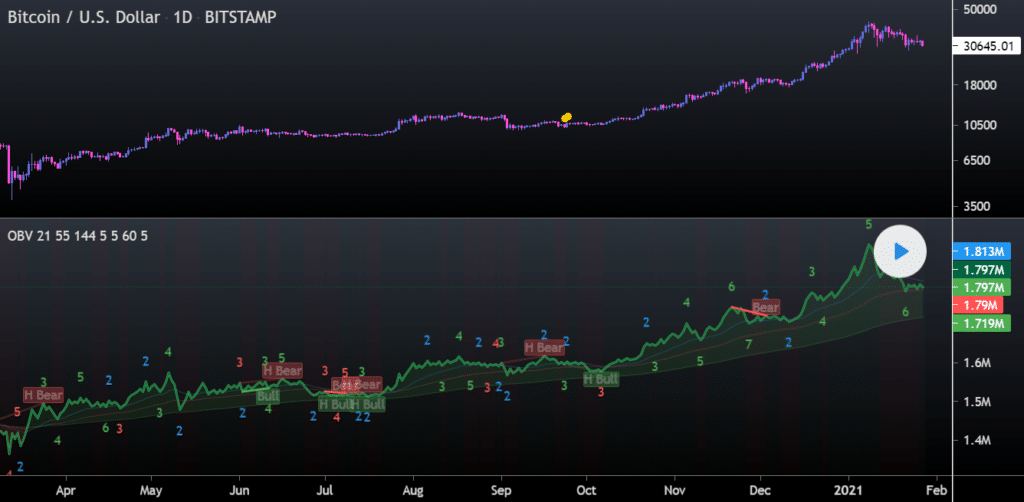
This strategy can be applied to any market and timeframe. Here the fields are denoted as subsequent highs and lows on the On Balance Volume Indicator. When the OBV reading exceeds the previous high pivot, the reading is UP and when it is below the previous low pivot, the reading is DOWN.
These fields indicate the direction in which the momentum advances. They can also be used for determining larger trends. For the UP field, the green background color is used, while for the DOWN field, the red color is used.
You can determine the major volume trend as the sequence of lowest lows and highest highs of the UP and DOWN fields. There is a rising trend when the highest high of a UP field is greater than the highest high of the preceding UP field and the lowest low of the DOWN field is higher than the lowest low of the preceding DOWN field.
For a falling trend, the opposite occurs. If neither occurs, the trend is termed as doubtful. On the chart, the rising trend is indicated by green, the falling trend is indicated by red, and for a doubtful trend, the blue color is used.
- OBV Accumulation/Distribution
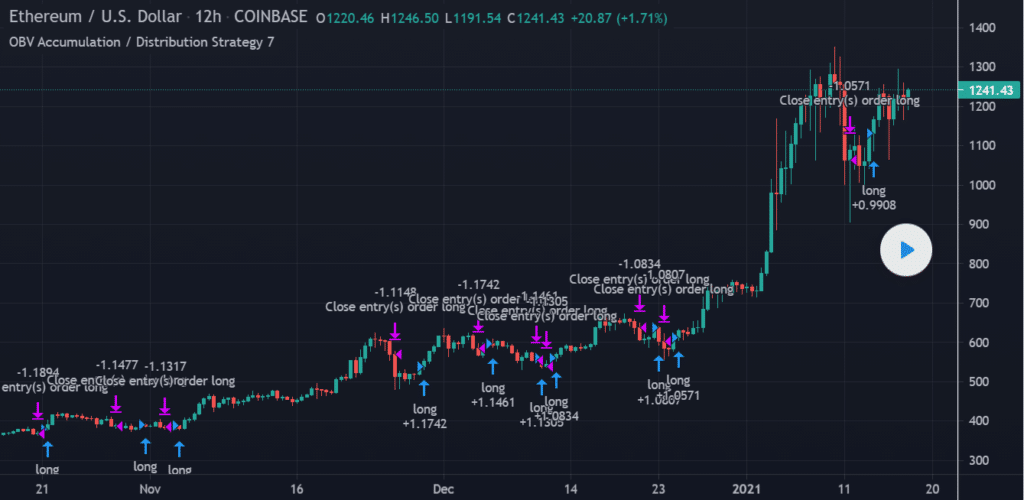
This strategy is perfect for the 8-12 hour timeframe, and you can use it for ETH pairs as well as others. Although the OBV and the accumulation distribution indicator are similar, they can sometimes diverge and move in opposite directions.
This is because the formulas for these two indicators are different. While the current close is compared with the current high and low for ADL, the OBV makes a comparison between the current and previous close.
To determine the direction of the price movement, you first need to check whether the asset is trending. Next, the presence of high volume must be confirmed. When, along with this, the indicators also match, a trade entry should be made with the trend.
Stop losses should always be used with this scheme and price action rules should dictate the correct position for them. For a long entry, a support zone must be found before the signal and the stop loss should be placed below. For a short entry, a resistance zone must be identified and the stop loss should be placed above.
- Price Volume Trend Oscillator
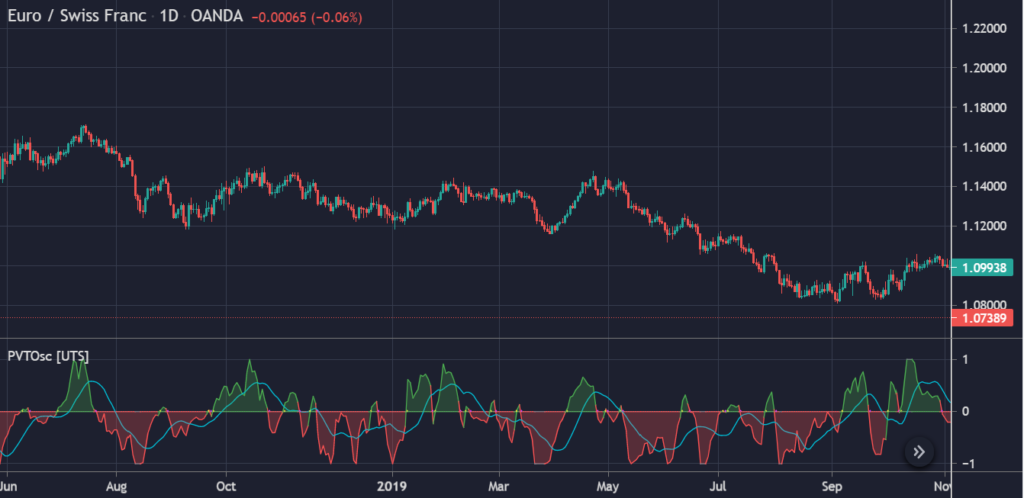
The Price Volume Trend indicator can be used for determining future price shifts. Although it is similar to the OBV indicator, here a certain portion of the volume is added to or subtracted from the total as opposed to the latter where all the volumes are added. Thus, PVT can represent money flow volumes with enhanced accuracy.
When the asset’s price rises and the PVT starts to dip, you get an indication that the price may reverse. The design of the OBV indicator is such that the same amount of volume is added, irrespective of whether the price’s closing point is higher by a small amount or by several multiples of its opening value. Conversely, the PVT adds the volume based on the amount by which the price closed at a higher point.
The PVT indicator can be used for trend confirmation, and you can also identify trading signals produced by divergences. Short and long signals are produced by PVT on zero line cross.
- Weighted OBV
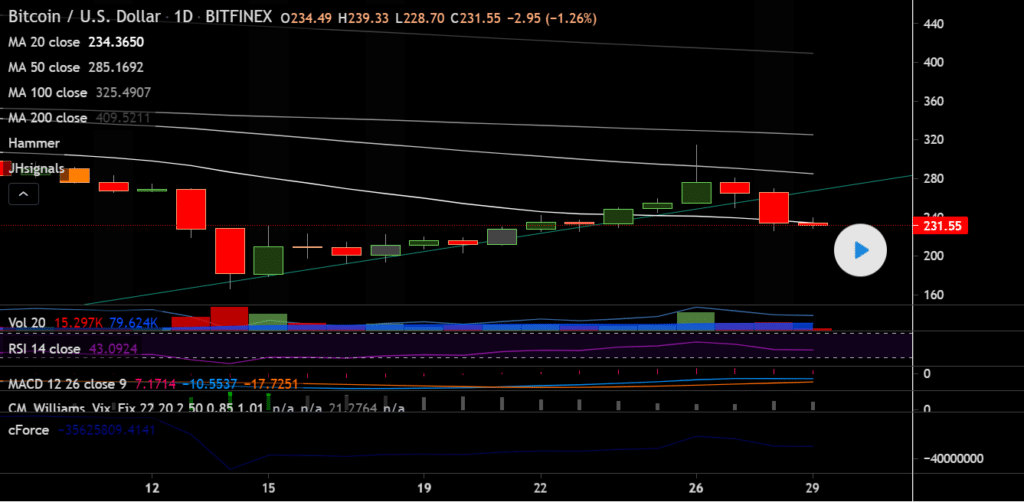
This trading scheme involves the cumulative force indicator, which is essentially an OBV indicator that factors in the price differences. A high volume bar holds great significance in a regular OBV. For example, if the price increased by 0.02, but later goes down by the same amount, OBV experiences a dip due to the volume, even though the change was negligible.
The cumulative force indicator offers a more realistic indication of the price’s direction. In order to calculate the weighted OBV for a particular day, the weighted OBV of the previous day is added to the difference between yesterday’s and today’s closing prices, multiplied by today’s volume.
- DMI + ADX + OBV
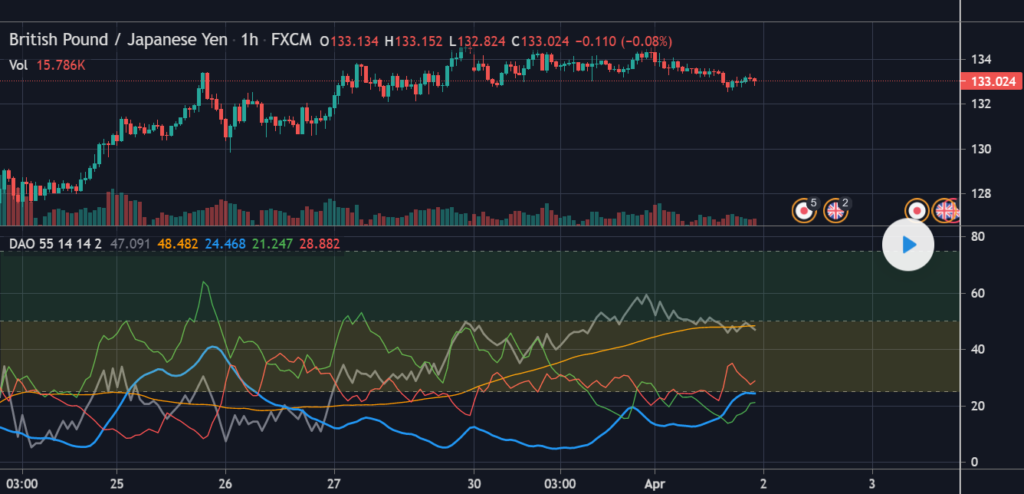
This strategy involves a normalized OBV indicator lying between -100 and 100 overlaid by an SMA with a period of 55, a DMI indicator showing the strength of uptrends with respect to downtrends, and an Average Directional Index that indicates the trend strength. The OBV indicator is represented by the gray line and it indicates the future of price movement.
For the DMI indicator, the red line indicates the strength of downward movement while the green line indicates the strength of the upward movement. ADX is denoted by the blue line, and when it is above the green area, there is an extreme trend. If it resides within the green or yellow areas, then the trend is strong and if it lies beneath the yellow area, the trend does not exist.
Summing up
The similarities within the above five chart situations are that they:
- Indicate the market’s strength or lack thereof
- Indicate a reversal
- Indicate climaxes and blow-offs


