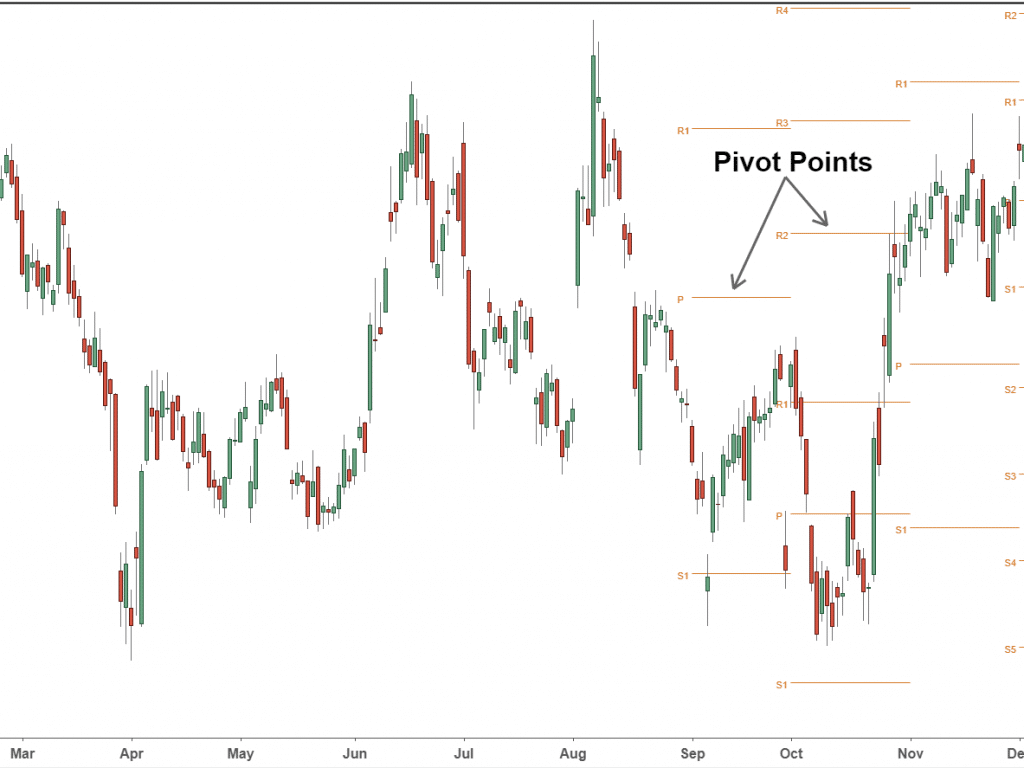
If you would like to know how you can invest money in stock, commodities, and futures, or wish to analyze the highs and lows of the market for intra-day trading, pivot points have got you covered.
Pivot points are an estimator for the markets for everyday traders. They indicate the highest, lowest, and closing prices at which futures, commodities, and stocks were traded during the previous trading day session.
Unlike moving averages and oscillators, they are static in nature and don’t change for the duration of a day. This characteristic allows the investor to lay down a framework and strategize their trading in advance. For instance, if the cost is under the pivot point, the investors are supposed to short sell in the early trading session.
On the other hand, if the price is above the pivot point, the investors are supposed to purchase. Tradings above and below the pivot points also determine the sentiments of the investor, whether it’s bullish or bearish.
Investors do not use the pivot points in a silo but combine them with various other indicators like the moving averages or the Fibonacci Extension level. Using such indicators in conjunction with pivot points improves the reliability of the estimations by helping the investor intuit the entry and exit points for both profit-taking and stop losses.
Calculation of Pivot Points
There are numerous ways Pivot Points can be evaluated, the most widely recognized of which is the five-point system. The system analyses the high, low, close of the day prior, along with two support and resistance levels. In the Forex market, which is a 24-hour market, the traders often use New York closing time 5:00 pm EST as the previous day’s closing.
The Pivot Points can be calculated in the following ways:
Pivot Point = (High + Low + Close) / 3
Support 1(S1) = (Pivot Point * 2) – Previous High
Support 2(S2) = Pivot Point – ( Previous High – Previous Low)
Resistance 1(R1) = (Pivot Point * 2) – Previous Low
Resistance 2(R2) = Pivot Point + (Previous High – Previous Low)
There’s an alternative variation to the five-point system which includes the opening price:
Pivot Point = (Today’s Opening + Yesterday’s High + Yesterday’s Low + Yesterday’s Close)/4
The resistance and support points can further be evaluated likewise as done in the Five-point system, without the use of the modified pivot point.
If you’d rather avoid doing the math, don’t worry! There are various samples of charting software available that will evaluate and plot all of the values for you. However, it is better if you understand the pivot point calculators, especially if you would like to backtest how these pivot points have held up in the past.
Trading using pivot points
The chief support and resistance while evaluating pivot points is the pivot point itself. This implies that the biggest value of the development is anticipated at this cost. While the other support and resistance are relatively less influential, however, they may lead to significant price movements.
Pivot points help determine and evaluate an overall market trend and are also used to predict the price levels to enter and exit the market. If the pivot point displays an upward movement, the market is interpreted to be bullish. While in case of the cost dropping through the pivot point, the market is interpreted as bearish.
There are two arrangement activities an investor can go with when intra-day trading – the pivot point breakout and bounce.
Pivot Point breakout
This technique enables the investors to strategize and use stop-limit orders, opening up a position when the price goes beyond a pivot point level. These breaks happen as frequently as conceivable towards the start of the day. An investor should look into starting short trade when the breakout has a bearish inclination and aim for a long trade. However, one should always set stop loss while the pivot breakout depicts bullish tendencies. Having the option to analyze where one ought to set the stop loss is also crucial. An ideal approach is to stick to the bottom or the top that is situated before the breakout as this secures the investor from any unforeseen price shifts.
Pivot Point bounce
This strategy focuses on the bounce in prices at the pivot points. A speculator’s cue to open trade is when the price reaches the pivot point and bounces. One should purchase the stock when there is an upward bounce and sell the stock when there is a downward bounce. In the event that the investor means to short, they should set the stop loss above the pivot point and below the pivot point if they’re aiming long.

How to enter a trade using pivot points?
Here is a simple step-by-step guide on how to use pivot points in your trades.
- Set up a chart. Post determining the pivot points, add the points to the open-high-low-close(OHLC) chart.
- Watch the market. Spectate on the market intently and know that the cost will approach the pivot points until the rice touches the pivot point, which would imply that the stock is being traded at the pivot price.
- Enter trade. Begin trading at the point when you find that the high of the initial price bar that couldn’t contact a new low has been broken.
Final thoughts
Pivot points can come in really handy for intraday traders. These points can be evaluated with a very simple formula and offer numerous benefits.
Although pivot points mostly offer reliable estimations, the dynamic market nature can’t provide static results and indicates that the prices will stop and reverse at the pivot points. It’s critical to remember that pivot points are mere projections, and one should not blindly rely on them to make trading decisions – they are best used alongside other indicators.


