During computation, the pivot point works as a support and resistance level, and the widest price movements frequently take place here. Although there are other support and resistance levels, their influence is considerably less.

Merchants often use pivot points to determine the dominant trend present in a market. If, during an upwards trend, the price line breaks through the pivot point, you can say that the market is uptrending. Conversely, if the price line intersects the pivot point and drops further downwards, the market is said to be downtrending.
Pivot points can also be utilized for determining suitable entry and exit points. If a resistance level is broken, you might want to place a limit order. On the other hand, a stop loss can be placed close to a support level.
Find out the five real charts below of pivot points that you might have missed.
Pivot points and ADX
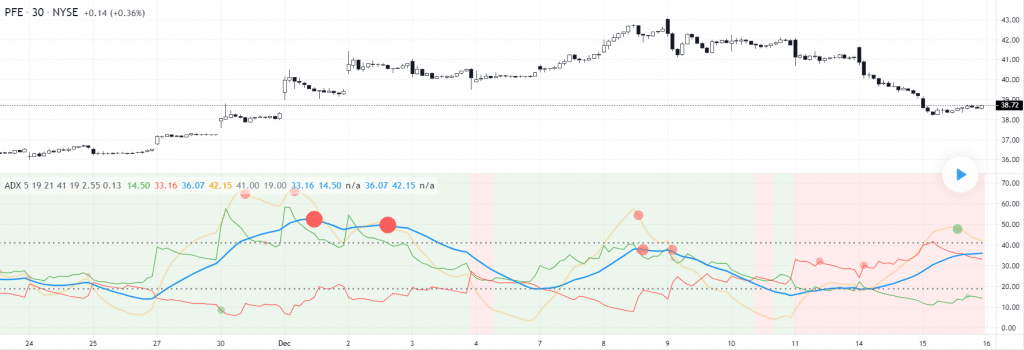
In this strategy, the size of each step, whether up or down, is equal to 1 Average True Range for “DI Length” candles. The green lines on the chart above depict upward steps while the red ones depict downward steps. When the red line lies above the green one, and you notice the price falling, it is a bearish trend.
On the other hand, when the green line lies above the red, the trend is said to be bullish. Notice the flat blue line representing the Average Directional Index (ADX). This depicts how strong the trend is.
The ADX line is computed by measuring its distance from the green and red lines, with the value being directly proportional to the distance. If the trend is really strong, then the movement in one direction is more prominent compared to that in the opposite direction, and this leads to the blue line growing at a swifter pace.
If you see the growth ceasing and the blue line changing direction, you should take it as an indication that the trend is over. The ADX indicator assists you in catching pivot points, and you can see the buy signals highlighted as green points and the sell signals highlighted as red.
When the dot is large, it means the signal is strong. The position of the red and green lines with respect to each other allows you to judge the trend’s direction.
Fibonacci pivot points
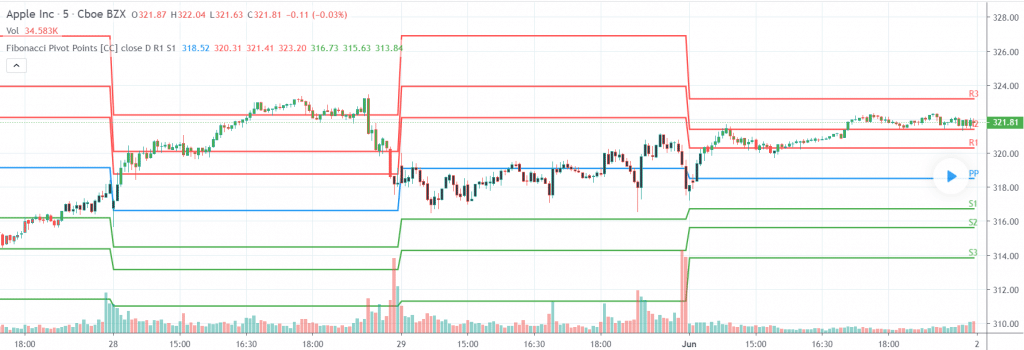
This is a strategy consisting of Fibonacci Levels and Pivot Points. Here, you first need to compute the pivot point in the standard way. After this, you should multiply the last day’s range with the proper Fibonacci level. The retracements used by the majority of traders are 38.2%, 61.8%, and 100%.
These results should be added to or subtracted from the pivot points in order to acquire the Fibonacci pivot point levels. You can easily find support and resistance levels this way. In the above chart, the green bars represent buying points while the red ones depict selling points.
Stoch RSI and pivot points
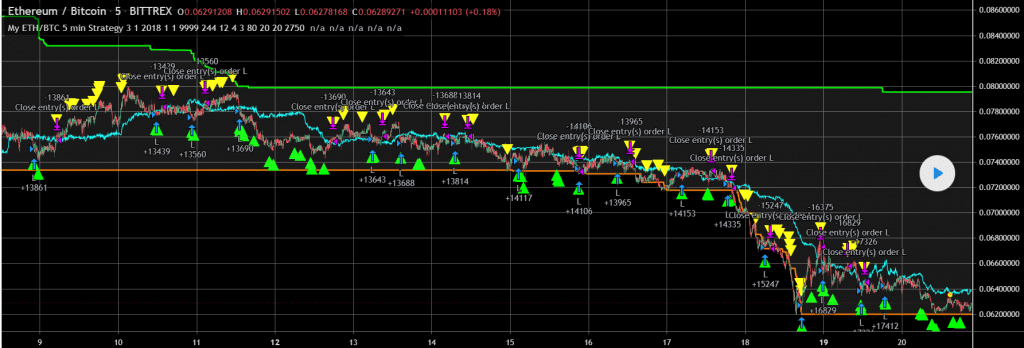
This trading strategy involves the Stochastic RSI and Pivot Points while dealing with the Ethereum/Bitcoin pair. You should enter this trade with a capital of $1199.56 for 5 minutes. The backtesting range should be a maximum of 15 days.
On the above chart, you can see the buying signals being represented by the green triangles and the sell signals being depicted by the yellow triangles. The basic principle of this scheme is to use a scalping technique while in range with the help of Stochastic. When a strong trend appears, it is the perfect opportunity to make an entry or exit.
MACD divergence
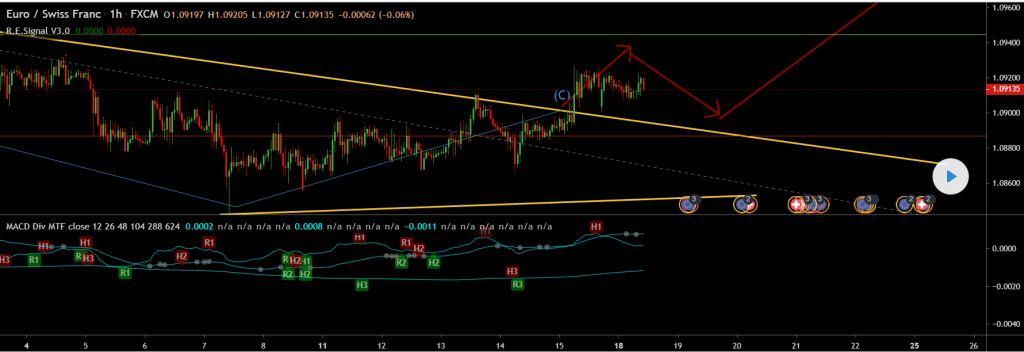
This strategy is based on MACD Divergence and is carried out for a time frame of 15 minutes for the EUR/CHF pair. The indicators involved in this scheme include Pivot Points and Moving Average Convergence Divergence (MACD) with periods of 12, 26, and 9.
Here the divergence acts as a signal that tells you that the market will undergo a reversal. If you are following a trend reversal strategy, you can use divergence for the final confirmation. This takes place when the direction of the market and the indicator is opposite.
Here you need to wait for the divergence to appear. Once it does, you should make sure that the price lies on or close to a pivot point for a smooth reversal to take place. If this condition is satisfied, you can make your entry and the next candle’s opening point.
Pivot point swing
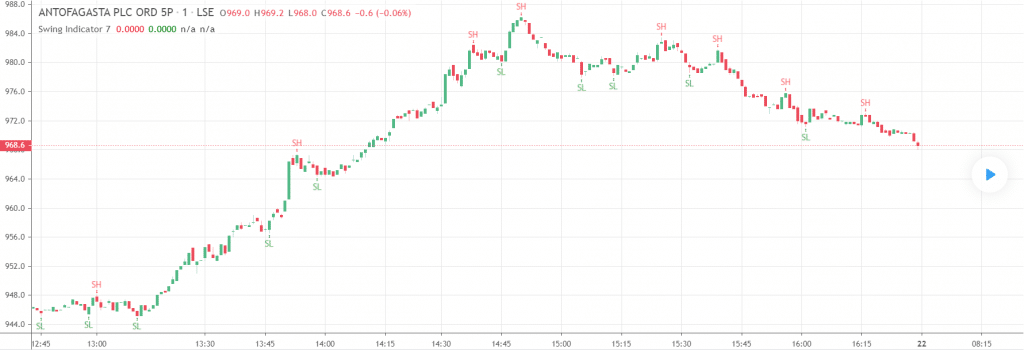
If you are a trader dealing with medium and long-term trends, the pivot point swing strategy is a good system to use for weekly or monthly timeframes. In the chart, you can see an upside trend reversal following the price breaking through the last pivot resistance.
The pivot price acts as a support level where Forex traders can place their long entries. Even after a false breakout, you can find an upside that is exploitable. You won’t always find the price in the pivot levels, but they offer a price level that assists in maintaining the directional bias.
Summing up
The similarities between the charts mentioned above are as follows:
- They generate price levels that assist in pointing out entries and exits.
- They help you point out vital resistance and support levels.
- You can determine the overall trend of the market by using them.
- Sometimes the price levels might have zero impact.
- You have to keep an eye on the previous day’s low, high, and close positions.
- They allow you to avoid most of the market noise.
- You can use them for short timeframes.
- You can use simple calculations for the pivot points.

