To the uninformed person, hearing about momentum in the forex markets could make them reminisce of a high school physics class. As in physical sciences, traders are interested in ‘the quantity of motion,’ or how strong or weak the price is moving at any time.
To measure this quality, we primarily use indicators tailor-made for this purpose. In this case, the two most popular options are the Relative Strength Index and Stochastics.
Both tools are technically oscillators, meaning their values are presented using a line graph ‘oscillating’ or moving between two extremes (0 and 100). Both the RSI and Stochastics show overbought/oversold events like most oscillators.
Last but not least, divergence is another classic feature of both. However, how do each of these match up when assessing momentum? Is one better than another? Let’s find out.
What is the RSI?
J. Welles Wilder Jr. (1935-2021) is one of the most influential figures in technical analysis, known for creating the Average True Range, Average Directional Index, Parabolic SAR, and, of course, the Relative Strength Index.
Wilder Jr. American published the RSI in the seminal 1978 book called ‘New Concepts in Technical Trading Systems.’ The RSI is one of the most popular indicators overall.
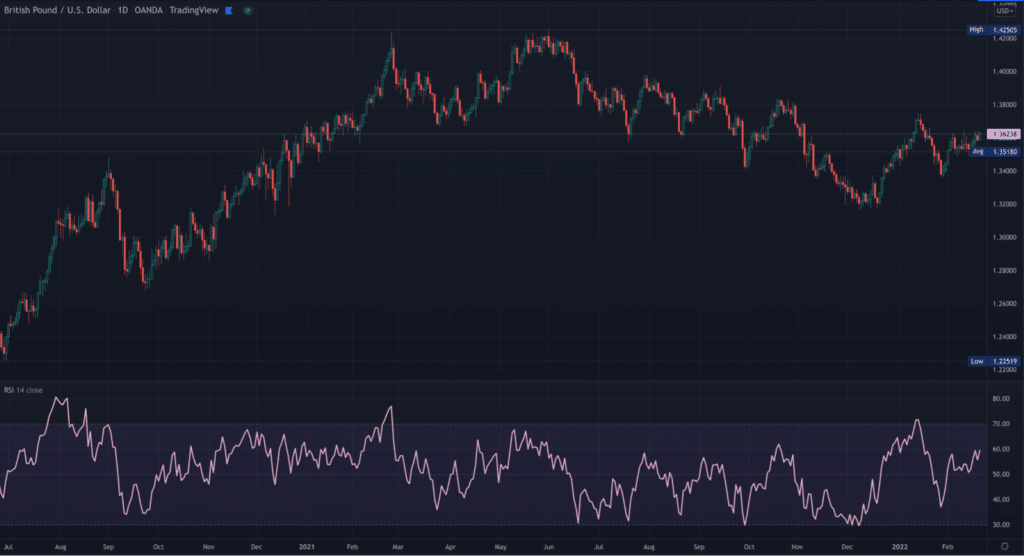
Like many technical tools, the RSI intends to chart the past strength and weakness of a security relative to its closing prices over a prescribed period, typically 14 days by default (although adjustable on virtually all trading platforms).
The result is plotted on a graph using a complex mathematical formula, resulting in a line fluctuating between 0 and 100. The most significant parts of the RSI are 30 and 70. Anything below 30 is regarded as oversold, while anything above 70 is seen as overbought.
What is Stochastics?
Stochastics are even older than their counterpart. The creation of this indicator is primarily credited to the late securities trader and technical trader George Lane (1921-2004) in the late 50s, along with other Chicago-based traders.
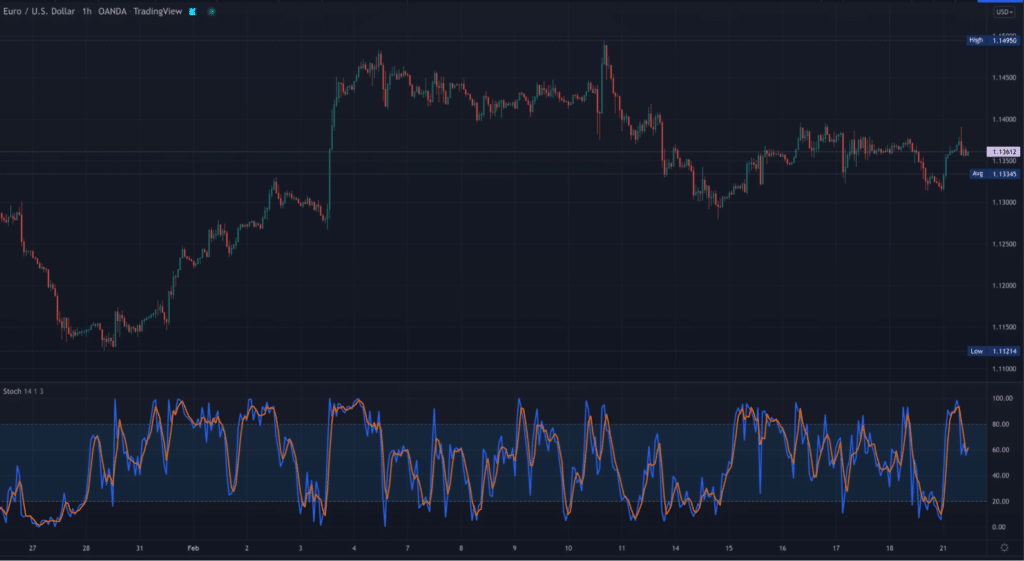
This indicator consists of two lines, the %K and %D, moving between 0 and 100 on a graph (with 80 and above being overbought, while 20 and below being oversold).
The %K line (the ‘fast’ Stochastic) uses a formula accounting for how the most recent closing price has closed in relation to the lowest and highest price over a default period of 14 days.
The %D line (the ‘slow’ Stochastic) is essentially a 3-period Moving Average of %K. Similar to the MACD, when the %K line goes above the %D line, it’s taken as a buying signal (unless the market is overbought).
Conversely, it’s seen as a selling signal when the %K line goes below the %D line (unless the market is oversold).
Main differences between the RSI and Stochastics
Let’s look at an example with the two indicators on a chart using the same 14-period settings.
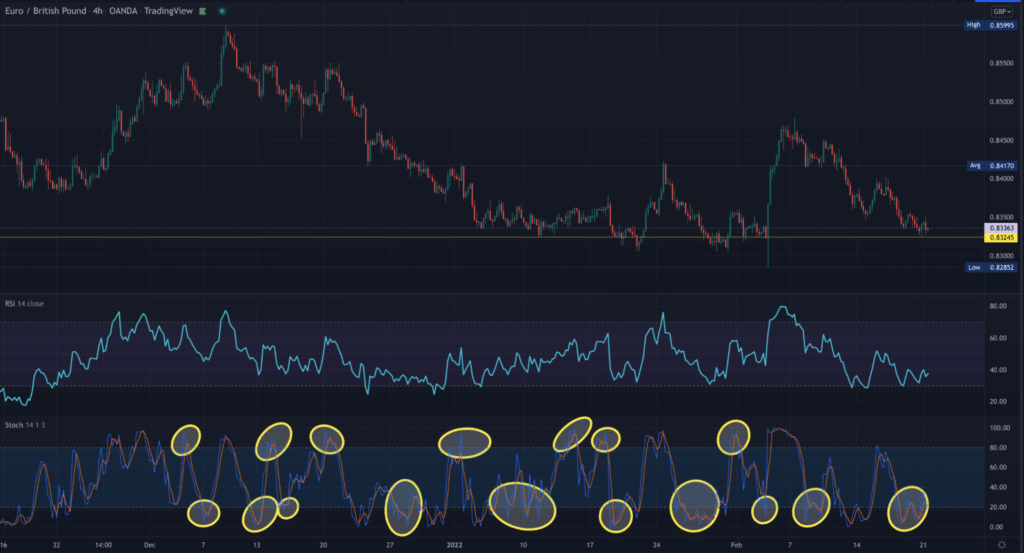
On the chart, we’ve circled all the instances of overbought/oversold on the Stochastics where the RSI didn’t present the same conditions. This tells us that the former is a lot more sensitive to even the slightest change in momentum.
Experts generally consider Stochastics best when used in ‘choppy’ or range-bound conditions. While being an oversimplification and not necessarily the most informed action, the general idea is selling when the price is overbought and buying when the price is oversold.
This could work better when the price is moving between a defined range. As we saw how many more overbought/oversold conditions were presented by the Stochastics, it makes this tool more suitable in this regard.
Yet, it doesn’t play down the difficulty in trading ‘choppiness,’ which isn’t something every trader can do successfully. On the other hand, the RSI is typically considered better in trending markets because of its relative stability.
However, you need to define precisely whether a market is ranging or trending before applying any of these indicators. Furthermore, since the RSI is less sensitive and slower, it produces more reliable divergences and overbought/oversold scenarios.
Stochastic RSI: combining the best of both worlds
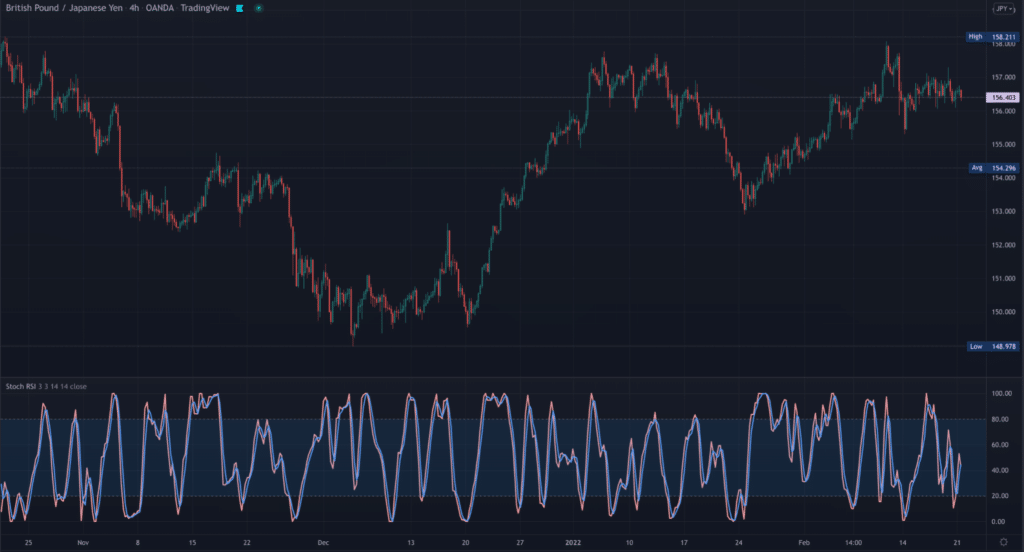
What happens when you intertwine the formulas behind Stochastics and the RSI? Enter the Stochastic RSI, a modified oscillator combining both tools in one. Stanley Kroll and Tushar S. Chande developed this tool and published it in the ‘The New Technical Trader’ book released in 1994.
This indicator intends to combine the Stochastics’ sensitivity with the RSI’s slowness. Visually, it looks almost identical to Stochastics. However, it is calculated differently from its predecessor.
The Stochastic RSI presents overbought/oversold events and divergences like both tools. Therefore, it may be an alternative to enthusiasts of both the original indicators.
Final thoughts
At the end of the day, these are both oscillators based on the same concept of how the current price closes relative to a price range over a certain period.
Thus, they do the same job, just using different formulas. However, they don’t necessarily produce the same results. Stochastics have generally been regarded as more reactive to price changes. This quality makes them more suitable for trading ranging markets.
On the other hand, the RSI is more stable overall and far less sensitive. Therefore, it’s fair to assume that it’s preferable to Stochastics when trading momentum-based strategies.
The other difference is that Stochastics have the crossover function with the %K and %D lines. This makes the tool similar to the MACD since some traders use this feature as an entry trigger, which is not present with the RSI.
However, ultimately, the RSI is probably the ‘better bet’ based on regularity. Yet, it’s always worth remembering that each is a lagging tool and should be used in conjunction with other analytical factors before making any trading decision.

