
Momentum trading is a strategy that analyzes how strong an asset’s recent price movements are to determine the best time to buy or sell. If there is enough force behind the price action, it is likely to continue in the initial direction for some time – that is the basic idea.

Let’s say the price of an asset starts to rise. More buyers will want to enter the market, causing the price to go up even higher.
The momentum may continue until sellers start to enter the market, causing the surge to stop. Finally, once the volume of selling outnumbers that of buying, the asset price can fall, and momentum should change direction.
As a trader, your focus is to identify assets with strong momentum to take advantage of the expected price movement.
In this article, I will explain to you a simple way to catch momentum in an instrument. I’m going to use the pair EUR/USD as an example.
Indicators:
- 20 period Moving Average
- Squeeze momentum
- Average Directional Index (ADX)
Next, let’s look closer at each indicator.
Moving Average
Moving Average (MA) is a price-based, lagging indicator that displays the average price of an asset over a set period of time. It is a good way to gauge momentum, confirm trends, and define areas of support and resistance.
Essentially, they smooth out the “noise” when trying to interpret charts. Noise is made up of fluctuations of both price and volume.
Because it is a lagging indicator and reacts to events that have already happened, Moving Average is not used as a predictive indicator but rather an interpretive one – mostly for confirmations.

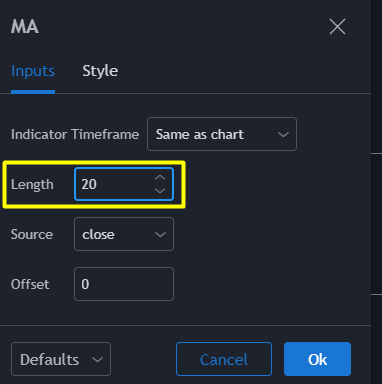
To plot the indicator in the TradingView chart, search for Moving Average and set the Length at 20.
Squeeze Momentum Indicator
This is a momentum indicator that tells us the explosiveness in price when the market is moving up or down.
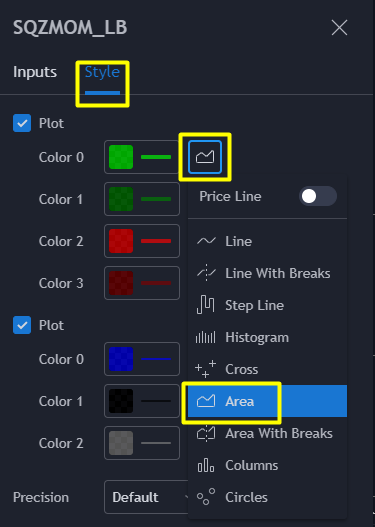
To set it up in TradingView, search for Squeeze Momentum Indicator (by Lazy Bear). You can change the style to Area.

This indicator is a derivative of John Carter’s TTM Squeeze volatility indicator described in his book “Mastering the Trade.”
The signals the indicator gives us to enter the market are the following:
- The black crosses in the middle line show that the market has just entered a consolidation phase (see below). This means low volatility, but also this means the market is preparing for an explosive movement (up or down).
- The gray crosses mean that “the squeeze” has been executed, price is moving up or down after a consolidation period.
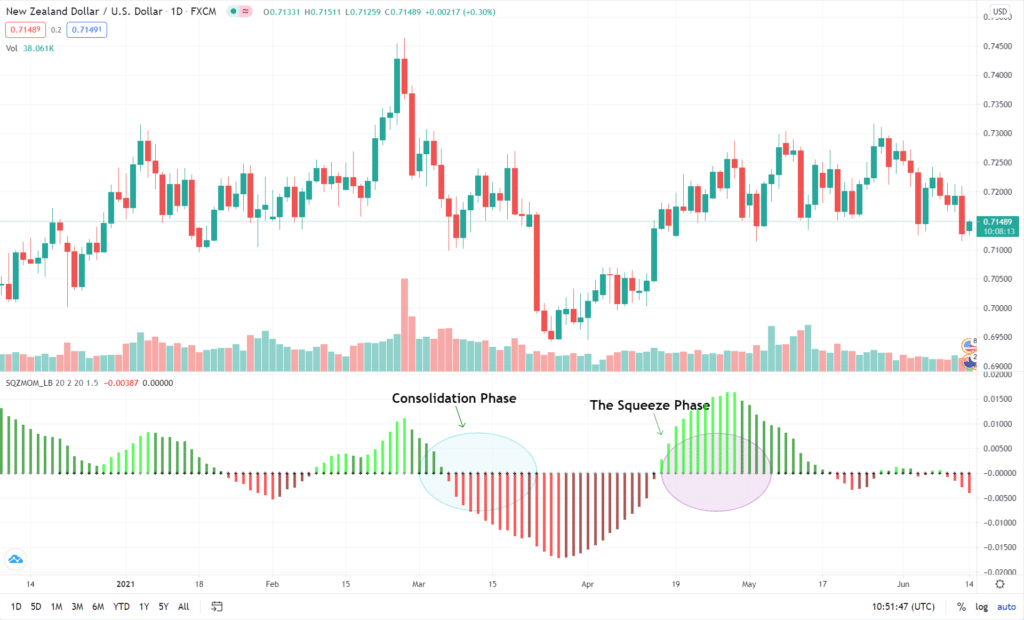
We should be waiting for the first gray after a consolidation period and taking a position in the direction of the moment (for example, if the value of the moment is greater than zero, go long (buy). Look at the example in the chart below.
Average Directional Index
One of the crucial aspects in trading is to know if the market is developing a defined trend – bullish or bearish. It’s also important to know if the trend is present at all, or the market is just moving sideways.
An operator who knows how to interpret market behavior will be in a better position to adapt his/her trading strategy.
Technical analysis has specific tools to be able to identify the market situation at all times and to be able to determine the strength of a trend.
One of the most used tools for this purpose is the ADX indicator. In fact, the ADX is the indicator that you often use to ultimately confirm the formation of a market trend.
ADX line positive = strength
ADX line negative = no strenght
To use the indicator in TradingView, look for the Average Directional Index (ADX).

You can employ ADX in different ways. The simplest way I found is to use it in combination with momentum indicators like Squeeze Momentum and Moving Average.
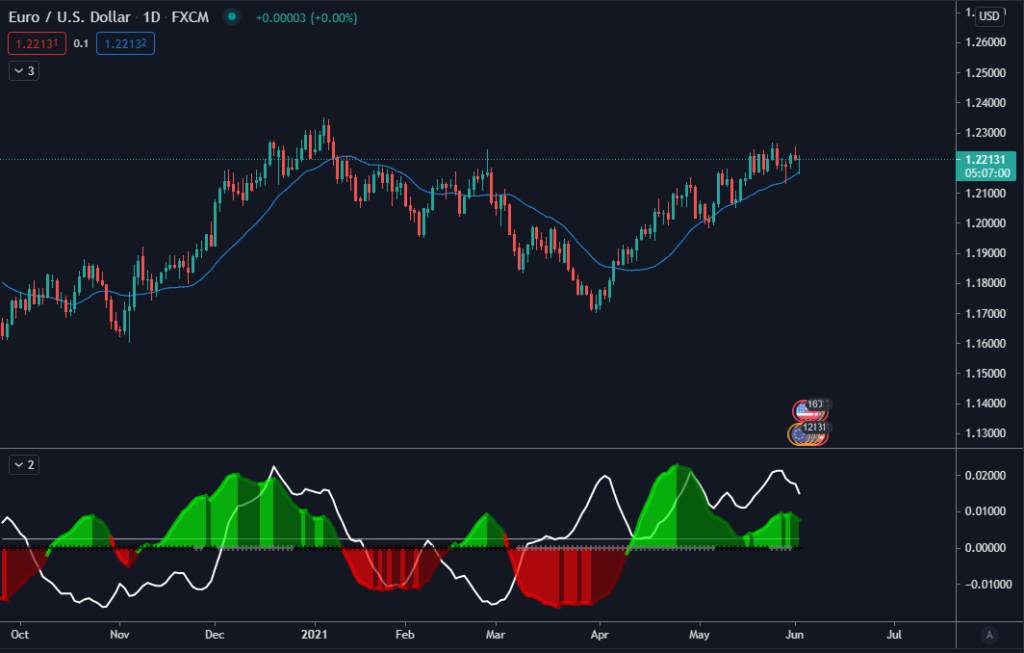
When we apply all the indicators, the chart will look like the one below.
Now I will show you multiple examples of when to buy and sell using all the indicators together.
To open a position, we are going to wait until the ADX line turns positive, Moving Average moves below the price, Squeeze Momentum goes above 0 (green light color). It shows the first gray cross after consolidation.
Buy Signal
- Moving Average below the price
- Squeeze Momentum is green, above 0, and gray cross
- Positive ADX shows strength
Sell Signal
- Squeeze Momentum is dark green
- Squeeze Momentum’s black cross indicates consolidation period
- Negative ADX indicates no strength
Here are examples of trading the strategy in different time frames.
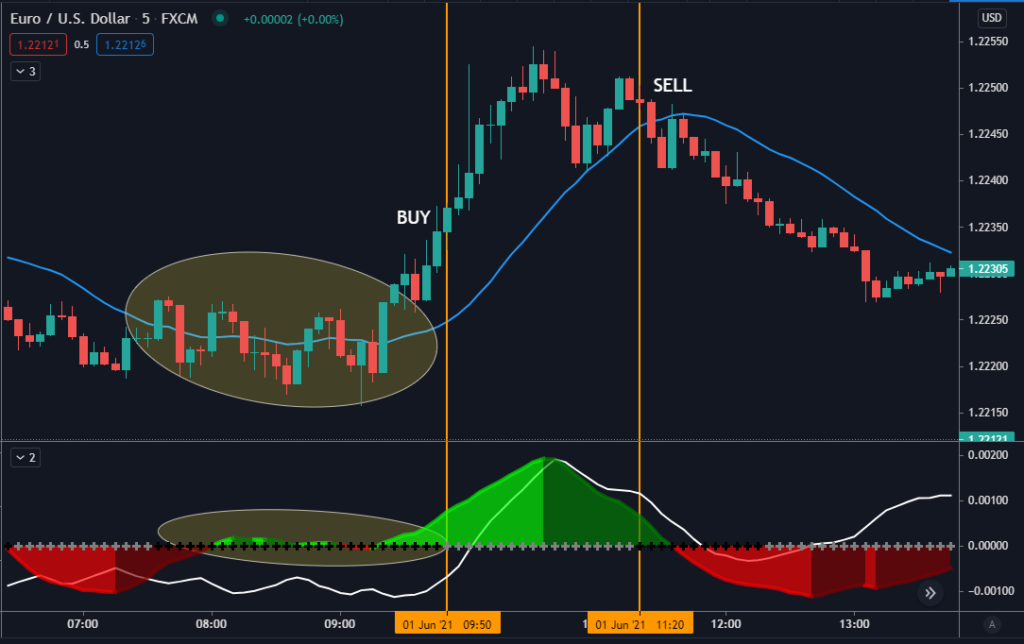
5 min chart
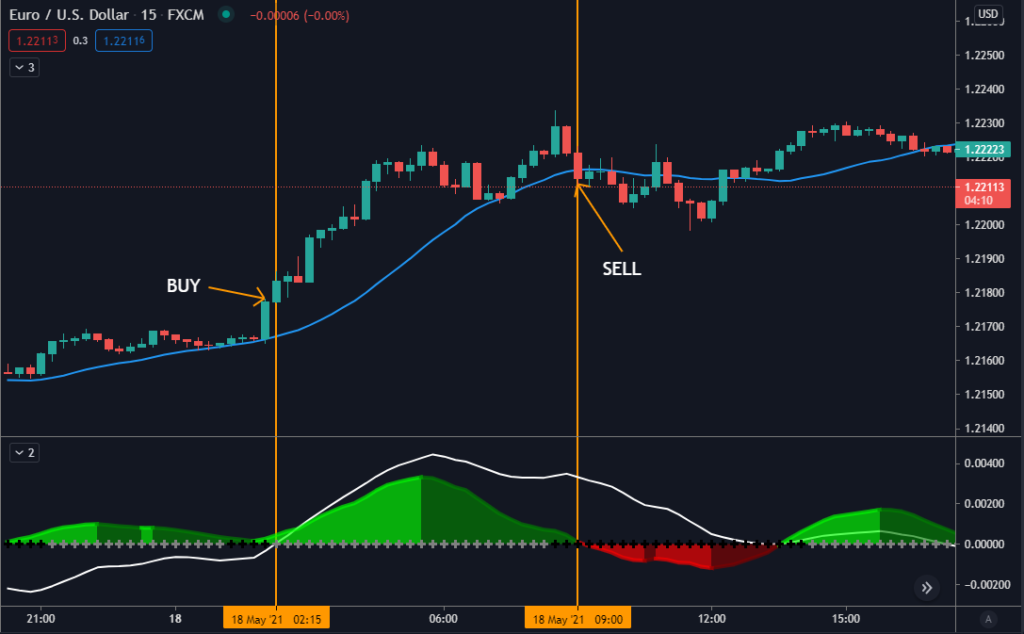
15 min chart
30 min chart
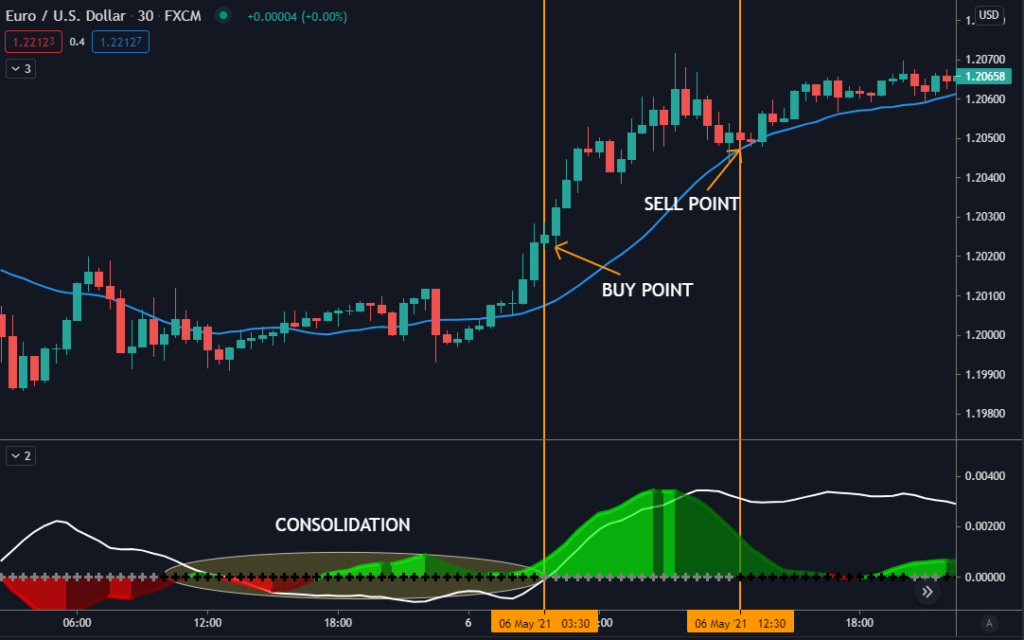
Note: if you use time frames like 5,15, or 30 minutes, you’ll get more entry points compared to applying the indicators to a 4-hour or daily chart.

