The Stochastic indicator is portrayed on the chart as two lines swinging between two horizontal lines lying in parallel. While the solid line is known as %K, the dotted one represents the 3-period SMA of %K and is called %D. When the two lines cross the horizontal line lying above, the price is said to be overbought, and when they cross the horizontal line below, it is said to be oversold.
Moreover, this indicator gives you a better understanding of when you should make your entries. When both the %K and %D lines are above the 80-line, and the former intersects the latter and moves downward, it is a potential entry signal to initiate a short trade. It is the exact opposite when the %K line intersects %D while they are both below the 20-line.
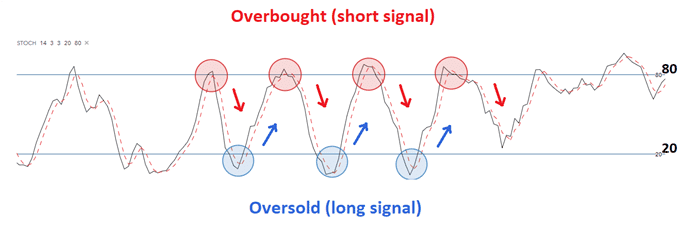
Top 5 charts for Stochastic
The top 5 Stochastic charts are the traders’ favorites for a reason. Keep on reading to find why.
Divergence

When a Stochastic divergence occurs, it means that the momentum has slowed down a bit for the price, and there might be a trend reversal or consolidation soon. For instance, if the price still keeps rising after an extended uptrend period and the Stochastic indicator begins exhibiting lower highs, it designates the slowing down of the price momentum and a probable reversing of the trend.
When you are looking for a buy signal, the initial value of the Stochastic should be under 20 (oversold region). Following this, the price action keeps moving further downward as the Stochastic advances upward still. This is a definite entry signal for buyers.
If you are looking to sell, the initial value of the Stochastic should be more than 80. The price action moves further upward following this, as the Stochastic moves downward. When the Stochastic is less than 40, the profit ratio for buy trades is greater, while the same is true for sell trades when the Stochastic value exceeds 60.
MACD

While using the MACD (Moving Average Convergence Divergence) indicator with Stochastic, you need to search for bullish crossovers occurring back to back with a maximum of 48 hours between the two. The crossover takes place beneath the Stochastic indicator’s 50-line in order to detect an extended price shift. By choice, the value of the histogram should be zero or advance upwards within 48 hours after you enter the trade.
Remember, the MACD must make the crossing following the Stochastic, since the opposite could generate a false price trend signal or put you in a horizontal trend. Buyers should look for the MACD to be more than zero and Stochastic intersecting the 20-line and moving up. Conversely, sellers ought to look for a MACD that’s less than zero and the Stochastic intersecting the 80-line and moving further downwards.
Coming to the stop-loss placement, it should be five points below the latest support region for buyers and the same distance above the latest resistance region for sellers.
Scalping
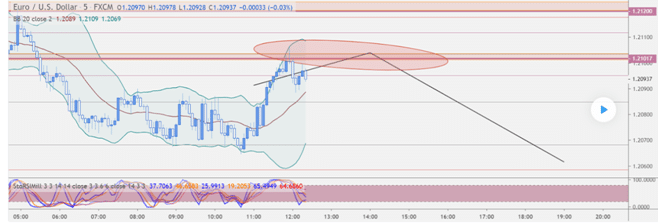
This is a strategy consisting of the Stochastic indicator and the exponential moving average of 200 days on the EUR/USD currency pair. For a buying setup, the price ought to be moving above the 200 EMA line, and the Stochastic line must have crossed the lower horizontal line and must be pointing upwards. This is the ideal opportunity to start a buy order, for which the stop loss should be placed at a distance of 15-20 pips, and the target for taking profit should be set at 20-30 pips.
For a selling transaction, the price of the asset must be moving beneath 200 EMA, and the Stochastic line should have crossed the upper horizontal line and must be currently pointing downwards. This is a good signal to place a sell order, placing the stop loss at 15-20 pips and the profit target at 20-30 pips. You can avoid false signals by not trading when the 200 EMA angle is too flat.
Bollinger Bands
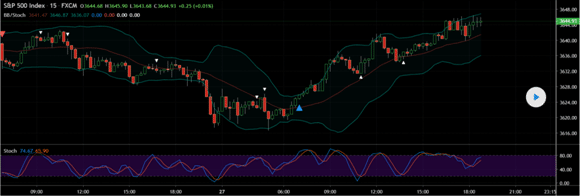
In this strategy, the Bollinger Bands assist you in outlining the point of entry and collecting the profits, whereas the Stochastic indicator is a good tool for timing your entry. Purchasers ought to stand by for an oversold condition where the Stochastic indicator lies below the 20-line. The lower BB must be intersected at the downside.
If these two conditions are satisfied, you can enter a long trade at the closing point of the next candle and place the stop loss at a distance of 5 pips below it. The profit target should be the middle BB.
Conversely, sellers need to look out for the rooftop penetration of the upper BB and an oversold region with the Stochastic value being more than 80. You need to make a short entry at the candle’s closing point with the stop loss placed five pips above it. The profit target should be the same as in the prior case.
RSI
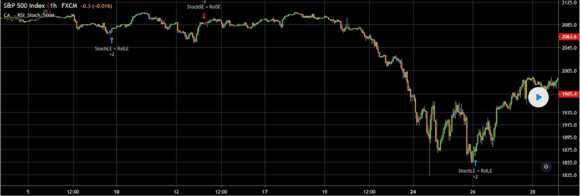
In a market that is not trending, using Stochastic RSI (Relative Strength Index) for trading oversold and overbought regions might bring about false signals. Using a divergence strategy is a much more prudent option. You need to plot the %D line of Stochastic RSI, along with the 200 EMA.
For a long entry, the SMA must remain beneath the price action, and the RSI must fall into the oversold region. At this point, you should search for the Stochastic line displaying a bull crossover. On the other hand, for a short entry, the SMA must show a bearish trend, and the Stochastic and RSI must remain within the overbought region. Additionally, the Stochastic line should display a bearish crossover.
Summing up
The chart patterns mentioned above have the following similitudes:
- They can be used for pointing out oversold and overbought regions.
- They can indicate day to day momentum shifts.
- All of them connote reversal signals through the divergence between the price action and the Stochastic indicator.

