Stochastic Oscillator Basics
A Stochastic Oscillator refers to a technical indicator that works to generate overbought & oversold signals. It compares a specific closing price of a security to a wide range of its prices over a specific time period. The oscillator sensitivity is typically reduced by considering the moving of the result or by adjustment of that specific time. It utilizes a 0-100 bounded range of values for the purpose.
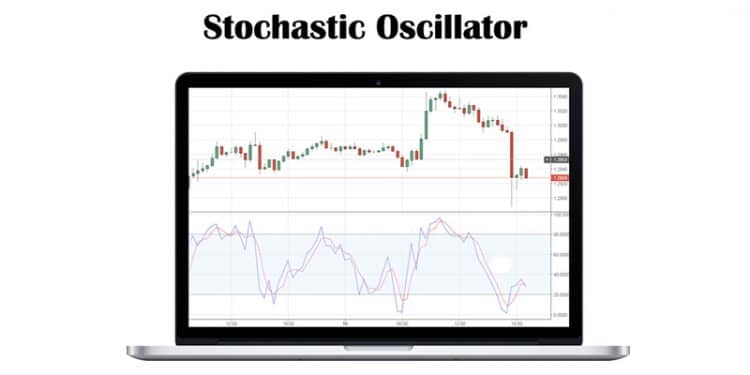
The charting is of two lines – the first line reflects the actual value of the oscillator for every session. The second line reflects the three-day simple moving average. As the price follows momentum, the intersecting line is a signal that there can be a reversal soon, since it signifies a big shift in the moment from a day to another.
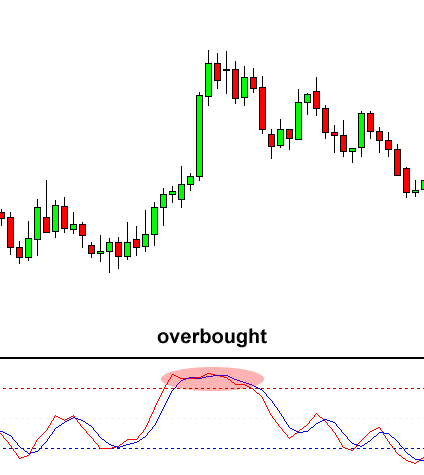
As seen above, the stochastic oscillator is range-bound. It is always between 0 & 100. Thus, it is an effective indicator of oversold and overbought conditions. Earlier, any reading above 80 would mean that it is in the overbought range. Readings under 20 would mean that it is oversold. But these do not refer to an impending reversal. If strong trends are there, they can maintain oversold or overbought conditions for a specific period. Traders can check changes in a stochastic oscillator for clues related to future trend shifts.

Creation of Stochastic Oscillator
George Lane developed the Stochastic Oscillator in the later years of 1950. In the original design, the stochastic oscillator presented the location of the closing price of a stock in relation to a specific high & low range of the price for a certain period. This time-period was 14 days. In several interviews later one, Lane mentioned that the Oscillator did not follow volume or price or anything similar.
He mentioned that the oscillator follows the momentum or speed of the price. He mentioned in several interviews that, it is a rule that speed or momentum of the price of a stock generally changes before any change in the price itself. Thus, the stochastic oscillator is helpful to foreshadow reversals as the indicator reveals bearish and bullish divergences. According to Lane, this signal is the most important trading signal.
Today, the stochastic Oscillator is present in almost all charting tools. The standard time remains 14 days, but it is adjustable so that traders can use it for specific requirements. The calculation is quite straightforward – starts with subtracting the low of the specific period from the existing closing price and then dividing by the total range for the specific time and multiplying it by 100.
Adjusting of Stochastic Oscillator
The selection of the most effective variables suited to a trader’s trading style will depend on the amount of noise one is willing to accept the data. Regardless of what one chooses, traders can improve their recognition of reliable signals as they build kore experience with the indicators. Market players who are in it for the short-term generally choose low settlings for all variables. This is because it provides earlier signals in the intraday market environment which is highly competitive. Long-term market players choose high settings for all variables. This is due to the highly smoothed output, reacting to major price action changes.
Usefulness for traders and automated trading
Identification of Overbought and oversold level: When the stochastic reading exceeds 80, it indicates an overbought level. Conversely, a reading below 20 will indicate an oversold condition in the market. When the reading goes above 80 and then returns below it, it generates a sell signal. Similarly, when the oscillator moves below 20 and back up above it, it generates a buy signal. Both overbought and oversold levels in a specified time period mean that the asset’s price is near the top or bottom respectively of its trading range.
Basic Strategies using Stochastic Oscillator
Before we take a look at some of the trading strategies involved with Stochastic oscillators we have to take a look at the signals it produces, particularly Divergence and Crossovers.
Divergence: When the price of an asset is making a new high or low which is not reflective in the Stochastic oscillator, divergence occurs. For instance, When the oscillator does not correspondingly move to a new high reading after the price moves to a new high, it produces a bearish divergence. Similarly, when the market price reaches a new low in which the oscillator does not register, it forms a bullish divergence.
Crossovers: The point of intersection between the fast stochastic line (denoted by 0%K) and the slow one (denoted by %D) is known as a crossover. A bullish scenario forms when the %K intersects the %D line, going above it. Alternatively, when the %K line crosses the %D from above to below, it produces a bearish sell signal.
Trading Strategies using Stochastic Oscillator
The trading strategy which combines Stochastic oscillator with Two EMAs
There is a very simple and effective trading strategy that combines the elements of the stochastic oscillator and Exponential Moving Average crossovers. This strategy works with time-frames such as daily as well as hourly. This strategy involves the stochastic oscillator and a 2 period and 4 periods EMA. This trading strategy involves the stochastic oscillator filtering out false signals, and buying or selling the EMA crossover.
Traders should go short when the 2 period EMA crosses the 4 EMA above and travels below it, with the stochastic being above 50. Similarly, traders should go long when the 2EMA crosses the 4 EMA from below, continuing higher when the stochastic is below 50.
When the stochastic enters an overbought (70-80) or oversold (30-20) position, or when the EMAs cross each other again, traders should immediately exit the position. Traders can use a trailing stop loss with a percentage or absolute value depending on their preference. Alternatively, if they want to set up an exact stop-loss level, they can either consider the low of the high of the entry day for a short position or the respective low for a long position. Traders should aim for a risk-to-reward ratio of at least 1:2.
The Bottom Line
Traders use Stochastic oscillators to measure both the momentum and the speed of a price over any period of time. They also use divergence signals produced by it for the identification of possible market reversal points. They work best when combined with volume and price movement, as well as chart patterns and leading indicators. Traders should pair them with multi-frame analysis.
Traders should be aware that the stochastic oscillator can produce false signals. This happens if it generates a trading signal but the price does not follow through. When this occurs, there will be a loss in trade. This tends to happen when the market is volatile and can even happy regularly. Thus, as a solution, traders can take the price trend as a filter as the signals will be taken only if they are in a similar direction as the trend. Alternatively, they can take the help of other technical indicators instead of using stochastic as the sole source for trading signals.


