The Awesome Oscillator, or AO, in short, is an indicator that is used to quantify the momentum behind price movements in the currency market. It is helpful in pointing out when bullish momentum dominates the market or when bearish forces have the upper hand. This way, traders can tell the most likely direction of price movement in a trending market.
Essentially, it is obtained by subtracting a longer-term Moving Average from a short-term Simple Moving Average. While this may not be new to oscillators, the truly awesome part about this indicator is that it utilizes the candle’s midpoint in the calculation of the SMA rather than the closing price. This puts it ahead above the rest, as midpoints provide a much more accurate measure of a candlestick’s volatility than its closing price.
Calculating the AO
As aforementioned, the awesome oscillator is obtained by subtracting a long-term SMA from a shorter-term one. On most platforms, the default periods used are 34 for the long-term and 5 for the short trade. In mathematical terms, this is to say:
AO = 5-period SMA – 34-period SMA.
However, the 34 and 5 figures are not set in stone – you’re welcome to tweak them in accordance with your strategy. The result, as Bill Williams famously put it, is an oscillator that is as simple as it is elegant.
How to read the indicator
The indicator resembles the MACD histogram, with a zero line at the center, around which the histograms fluctuate from the positive to the negative zone. Positive bars are colored green, while negative bars are red. A positive bar implies that the shorter-term MA is greater than its longer-term counterpart. Conversely, a negative bar implies the longer-term MA is the greater one of the two.
Therefore, whenever the AO is in the positive zone, it implies that prices are in an uptrend. The converse is true as well – the AO when in the negative zone implies that prices are in a downtrend. It is not uncommon to see red bars in the positive zone or green bars in the negative.
Obtaining trade signals
There are several ways to generate trade signals using the awesome oscillator. We shall discuss each of them below.
1. Crossing the zero line
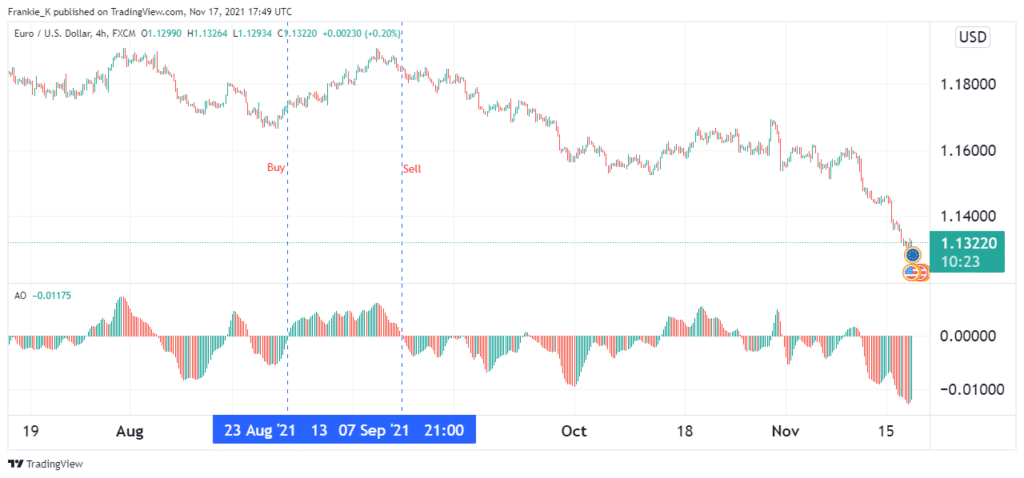
This is the most rudimentary signal generation technique using the AO, and not surprisingly, the most commonly adopted. It involves waiting for the histograms on the indicator to form above the zero line for a buy trade and below the zero line for the sell signal.

This is because, as aforementioned, when the oscillator is in the positive region, it points to a market in an uptrend. In the negative region, it suggests the market is in a downtrend. An example is shown in the EURUSD four-hour chart above.
2. Saucer technique
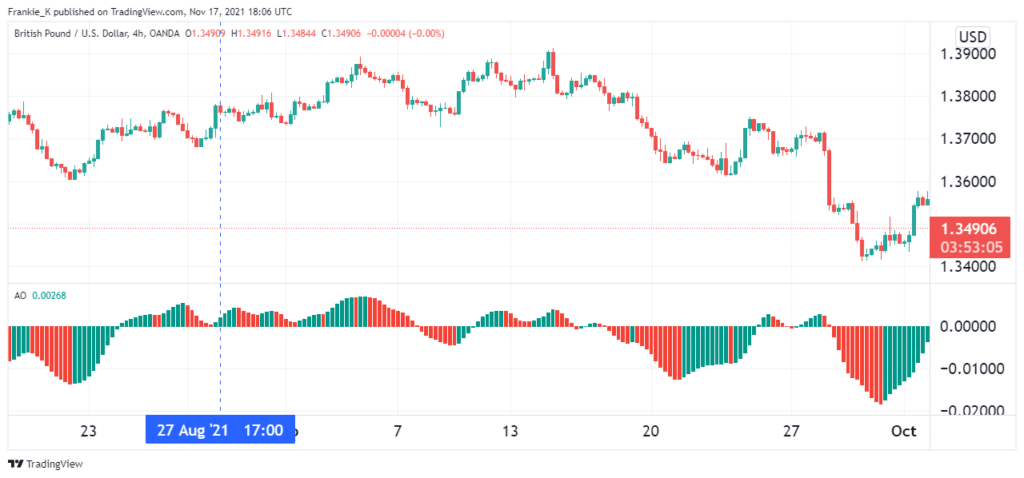
This technique involves three consecutive bars on the AO histogram. If you wish to enter a long trade, the oscillator must first be trending in the positive zone. Once this is satisfied, look for two consecutive red bars, with the second bar being shorter than the first. The third bar should be green and taller than the second one, such that the three bars form a saucer shape at the top, hence the nomenclature. If this is satisfied, one can go long at the fourth bar’s open.
The example below shows this technique in practice.

Similarly, for a short trade, the histogram must be trending in the negative region. Next, look for two consecutive green bars, with the second bar being longer than the first. The third bar should be a red bar and preferably shorter than the middle bar. Once all these ducks are aligned, you can place a short at the fourth candle’s open.
3. Twin peaks technique
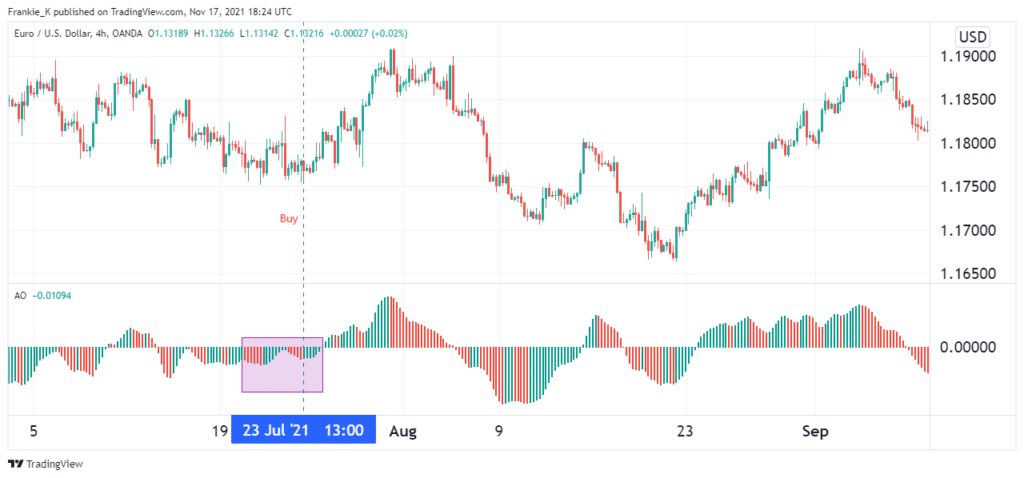
This technique is used to predict potential trend reversals. For a bullish reversal signal, look for two consecutive peaks in the negative section of the AO. The second peak should be higher than the first peak, which means it should be shorter in height since it is in the negative zone. Further, the trough between the two peaks should remain in the negative region. The third condition is that the second peak must be followed by a green bar.
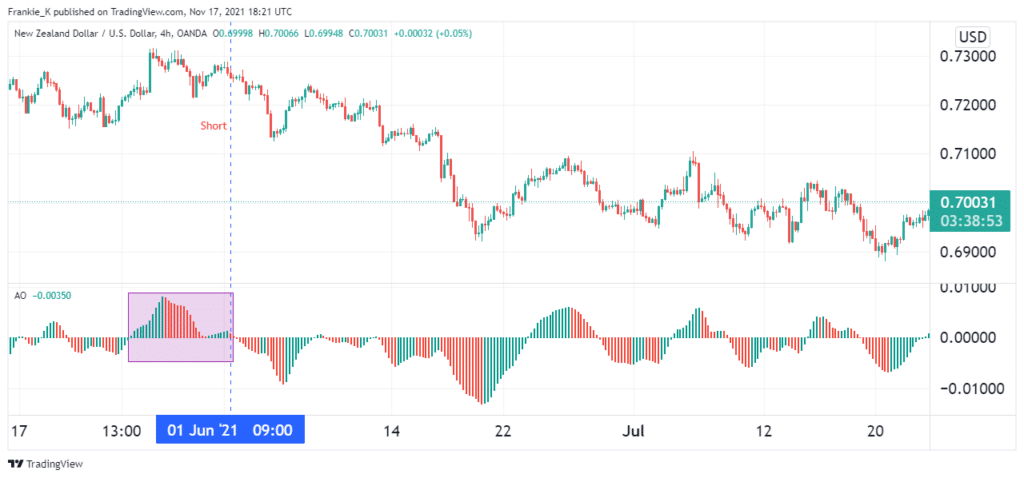
Conversely, the signal for a bearish reversal occurs when the two peaks manifest on the positive region. In this case, the second peak should be lower than the first, and the trough between them should remain in the positive zone. Further, the second peak should be immediately followed by a red histogram bar.
The examples below illustrate this technique.

In the chart below, we get the buy signal when the second peak produces a green bar.

The last illustration shows how the AO generates a short signal after a little second top turns red.
Combining the AO with other indicators
The awesome oscillator should be used in conjunction with other indicators to minimize the risk of trading on false signals. Those other indicators could provide signal confirmation, thus increasing the chances of profiting from said signals. You can use the AO with indicators that show when a pair is overbought or oversold, such as Stochastics and RSI.
Conclusion
The awesome oscillator is an indicator that shows the momentum behind market trends. As such, it is best used for trending markets. It differs from most oscillators in that it utilizes median prices for its SMA calculation rather than using closing prices. The signals from this indicator can be obtained by waiting for the histogram to cross the zero line, waiting for twin peaks to manifest, or using the saucer strategy. For best results, the signals from the AO should be confirmed by signals from other indicators such as the RSI and Stochastics.


