
Let’s define support and resistance zones and how to identify them.

Support and resistance are fundamental pillars in trading, and most strategies have some type of analysis related to support or resistance (S / R). They tend to develop around key areas where particular price levels are regularly approached and corrected.
Support and resistance are some of the most followed technical analysis techniques in financial markets.
It is a simple method to quickly analyze a chart to determine three points of interest for a trader:
- The direction of the market
- An entry point
- Exit points either with profit or loss
If a trader can answer all three of the above, then they essentially have an understanding of trading.
Support
Support is an area in the chart where the price turned down and struggled to break below. The chart below shows how the price falls to the support area and then “bounces” sharply from this level.
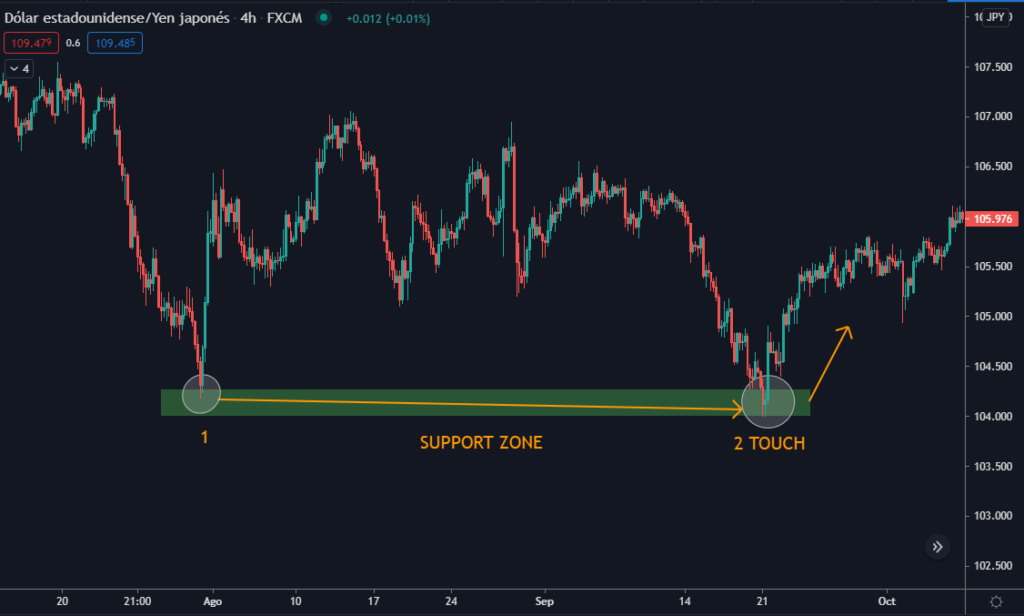
In theory, support is the price level at which demand is strong enough to prevent the price from falling lower.
The reason is that as the price gets closer and closer to support and in the end, the instrument becomes cheaper, buyers see a better offer and are more likely to proceed to buy the asset.
Sellers become less likely to sell as they are getting a worse deal. In that scenario, demand will exceed supply which may prevent the price from falling below the support.
You can identify support when the price touches the same level and bounces, as you see in the chart above.
Resistance
The resistance level is a price area on the chart that the market approached but couldn’t go higher.
Going deeper, it’s the price level at which the supply is strong enough to prevent the price from rising further. The rationale for this is that as the price gets closer and closer to resistance and the asset becomes more expensive in the process, sellers are more likely to sell, and buyers become less likely to buy.
In that scenario, supply will exceed demand preventing the price from breaking through resistance.
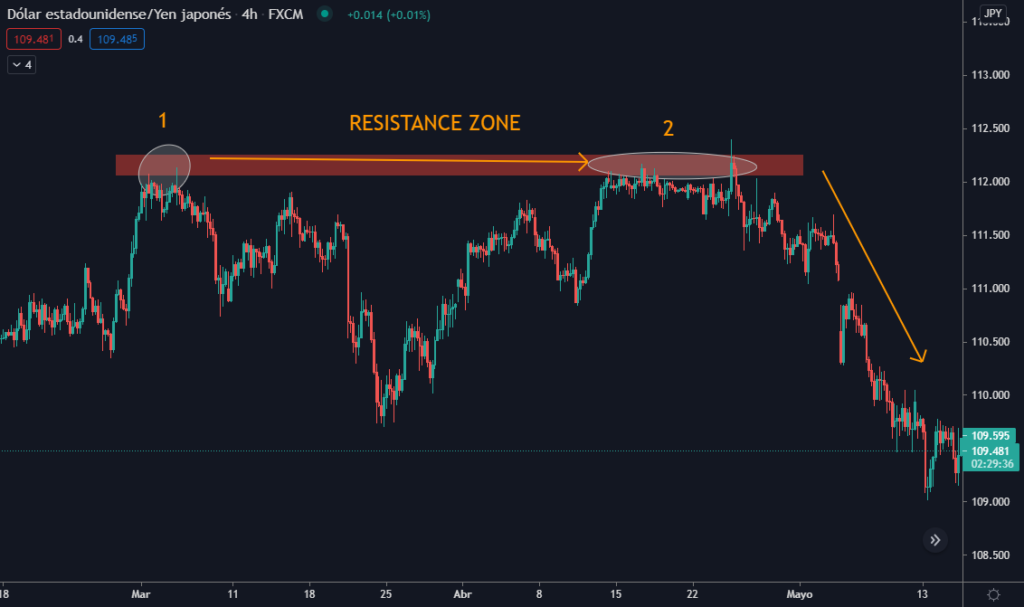
The chart above shows how the price rises to the resistance area and then “falls” sharply from this level.
Volume Profile
Okay, we know about supports and resistances. Now let’s talk about Volume Profile.
Find it on TradingView by typing Visible Range.
It’s helpful to detect the price levels with a high volume, where the asset has changed ownership. The buyers and sellers are using those values as a benchmark.
The first thing that most traders will use the Volume Profile for is identifying basic support and resistance levels.
It is important to note that using Volume Profile as an identifier for support and resistance levels is a reactive method. Reactive methods rely on past price movements and volume behavior. The approach can help apply meaning or significance to price levels that the market has already visited.
High Volume Node
Volume nodes in HVN are peaks in volume at or around a price level. HVN can be seen as an indicator of a period of consolidation.
Usually, there is a lot of activity on both the buy and sell-side, as the market stays at that price level for a while, compared to other levels in the profile. Look at the chart below to see HVN.
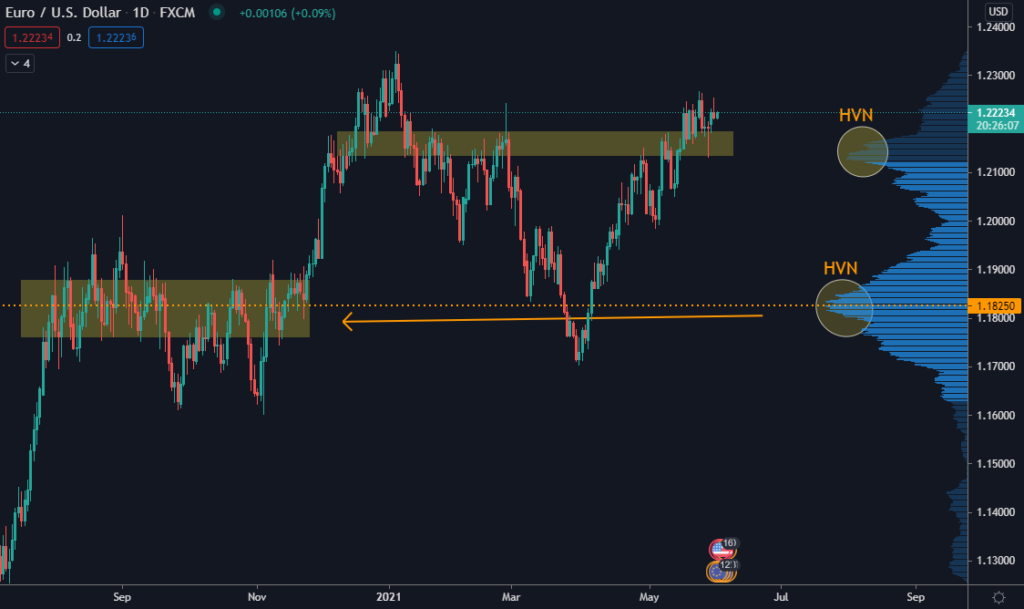
Low Volume Nodes (LVN) are the opposite. They are valleys (or significant drops) in volume at or around a price level. Low Volume Nodes are usually a result of a breakout rally or a breakdown.
There will typically be an initial burst of volume during a rally or a breakdown and then a significant drop-off. Look at the chart below to see LVN.
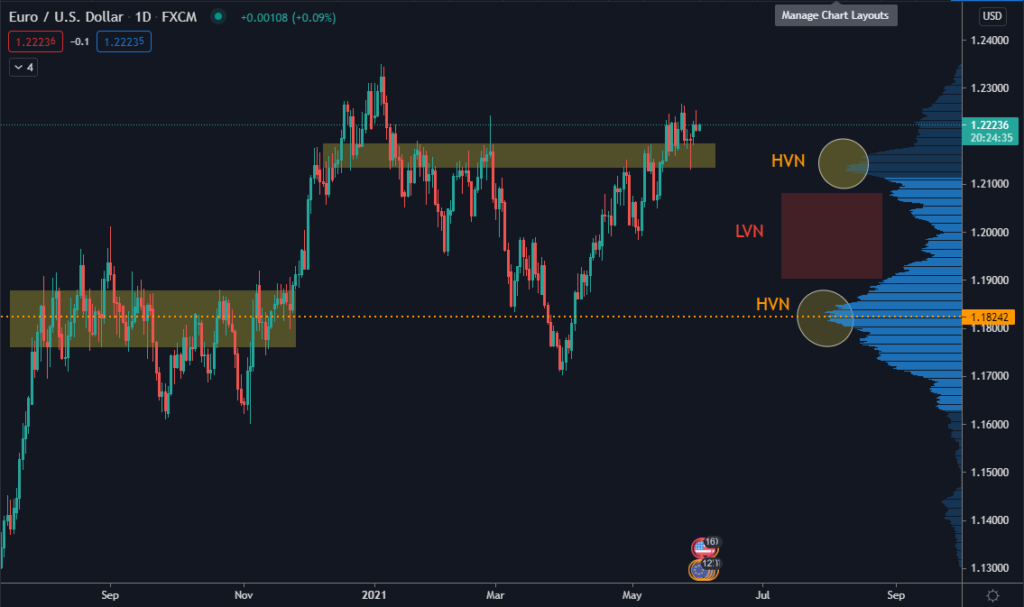
Note that a sustained period of sideways movement is expected when the price approaches a previous HVN (or fair value area). The market is less likely to break through that price immediately.
With LVN being the opposite of HVN, when price approaches a previous LVN (or unfair value area), the market is much more likely to rally through or bounce off of that price level.
As LVN is seen as an unfair value area, the market will not spend as much time there as some other profile levels.
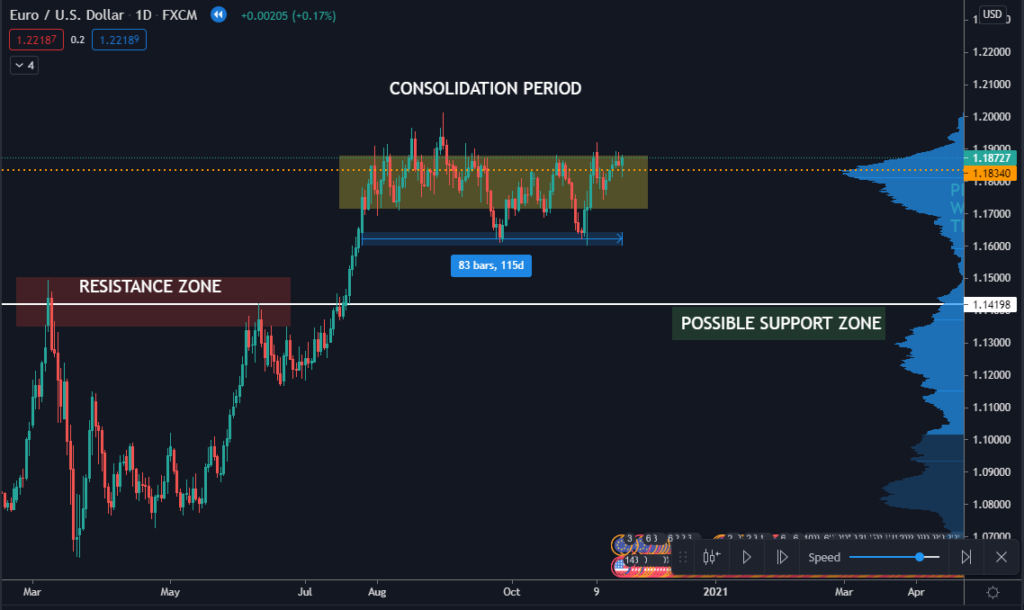
Now, I will show you how to trade with support and resistance and volume profile. Let’s go back in time and look at the chart below.
Price is moving sideways for 115 Days. We don´t know if the price will fall or rise, but we have data about the resistance zone that becomes a possible support zone.
Well, if we see in the following days, the price rose, and the possible support zone moves up from 1.14 to 1.20
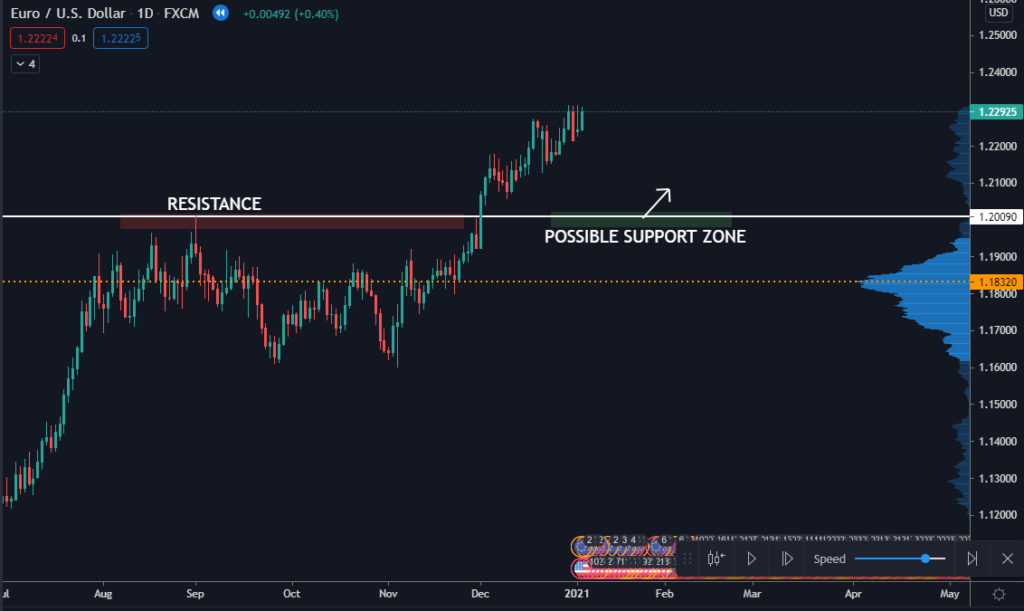
Following the price, we see that it touches the support zone that I previously marked and bounces.
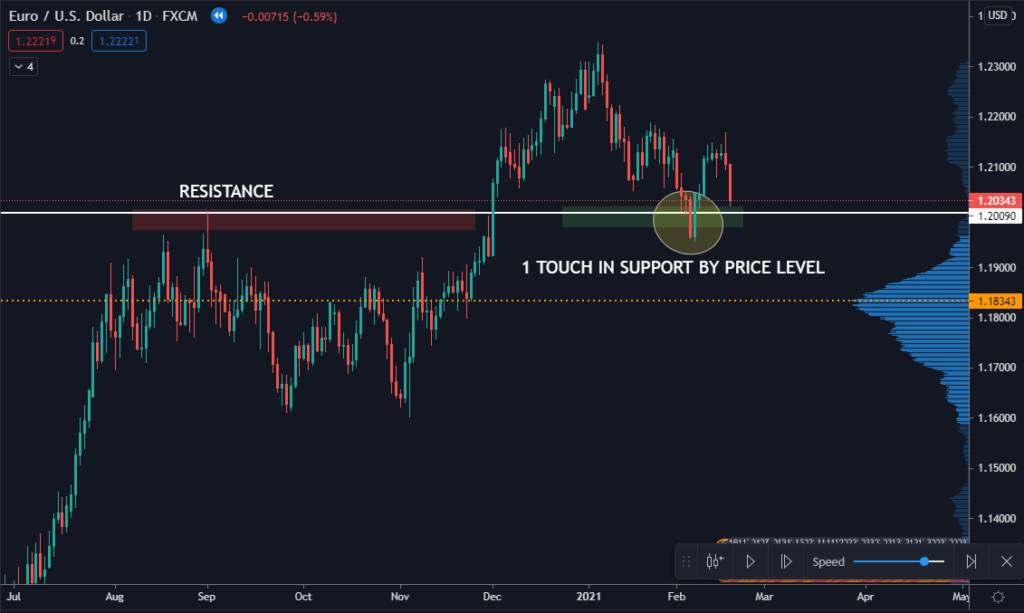
But, this resistance level of 1.20 could be broken because it is not a High Volume Node, so I could expect the price to move down again to 1.18 level. Let’s see what happened after.
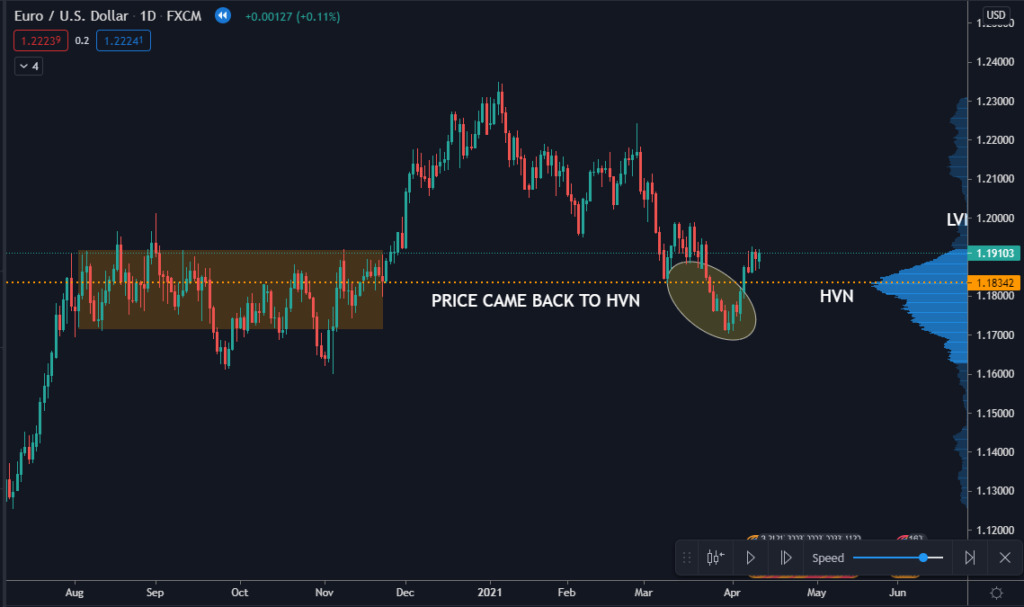
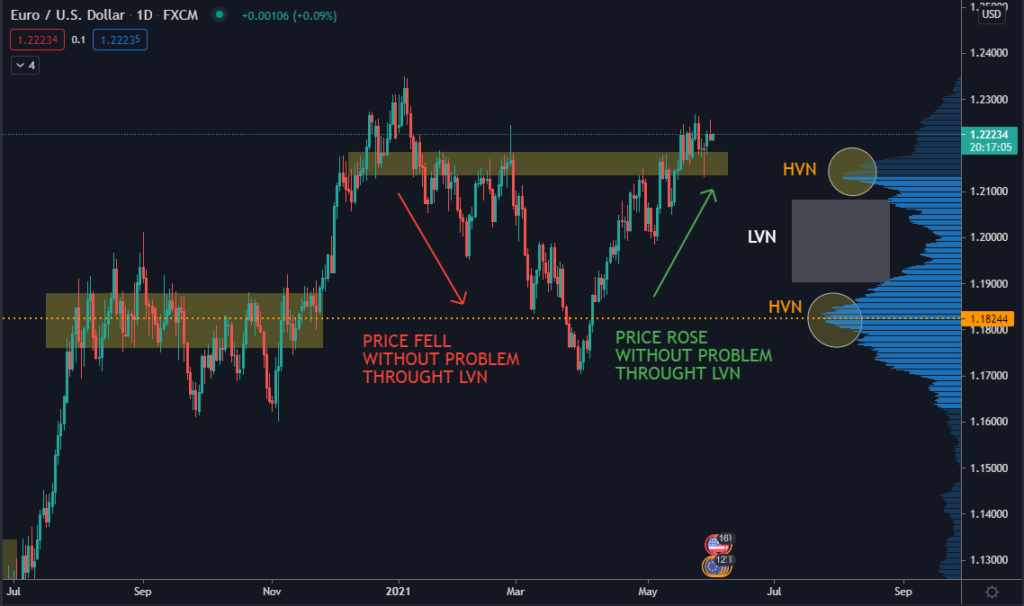
As I said, the price came back to the HVN zone and bounced fastly through LVN.
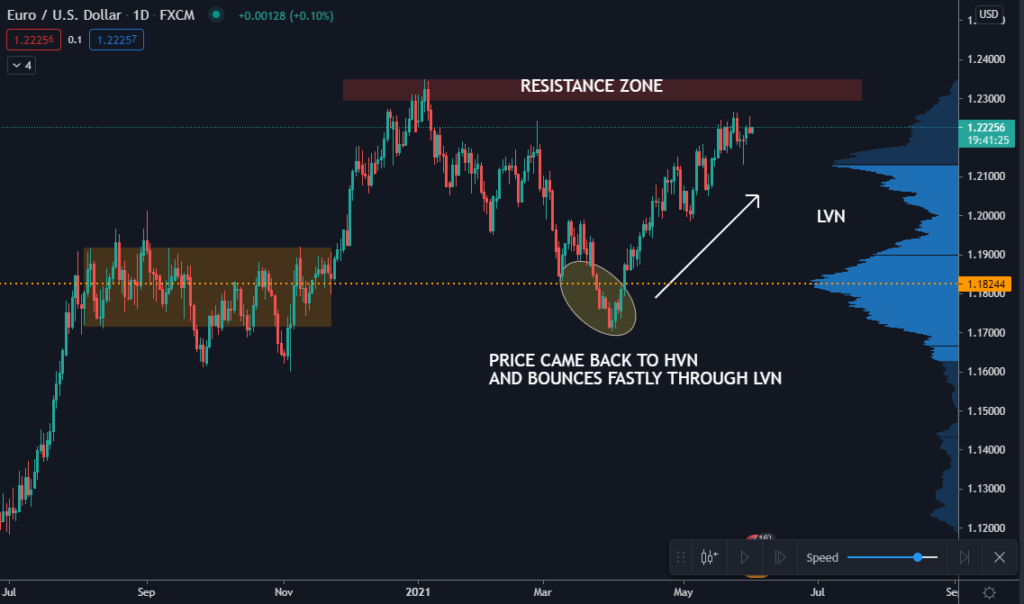
If you see the sequence of charts I showed you, I combined volume profile with classic support and resistance levels to increase my probabilities of success.

