The Elliott Wave theory is arguably the most advanced form of technical analysis in financial markets. Any style of technical analysis aims to predict very repeatable patterns that enforce particular market behavior and psychology. Elliott Waves embody these traits precisely.
Published in his famous book, The Wave Principle, Ralph Elliott (1871-1948) devised the Elliott Wave principle or theory. An accountant by profession, he published all his findings in the book based on several decades of personal stock market observations. His theory states all market trends move in a 5-wave impulse and a 3-wave pullback or correction (also referred to as the ABC).
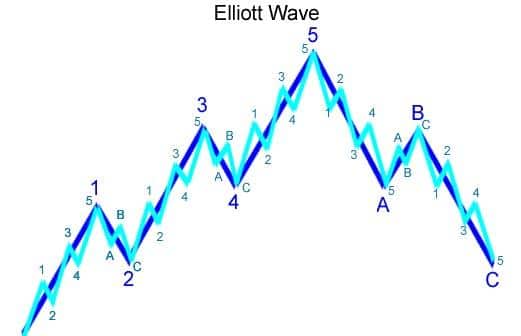
We can witness this wave structure from a time-frame as erratic as the one-minute chart to larger time-frames like the monthly. Within each wave itself, the same 5-wave impulse and 3-wave pullback occurs in finer and finer degrees, which we refer to as the fractal nature of the markets. Each wave exhibits unique characteristics in terms of structure and reflects a different market psychology stage.
The foremost criticism of the Elliott Wave principle is its high complexity and subjectivity. Even though we have Fibonacci ratios and rules for the wave count, they are usually never exact. Elliott Wave enthusiasts use distinctly defined Fibonacci ratios, other patterns and confirmations to trade specific waves. Though the theory is very advanced, it provides a broader market context for knowing where one is in the cycle.
Motive and corrective waves
There are two kinds of waves, a motive wave and a corrective wave. In a bullish trend, the motive waves are those in the direction of the trend, while the corrective waves are those counter to the trend (vice versa for a bearish trend).
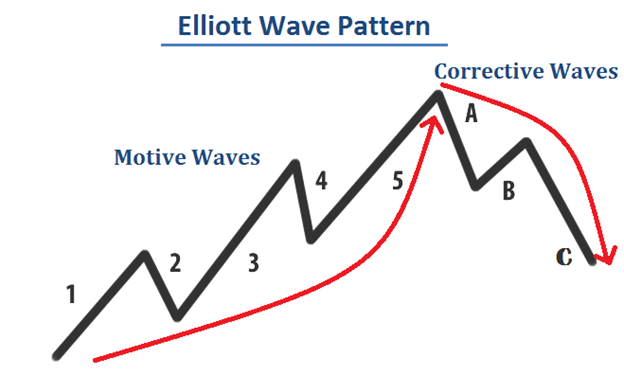
In the primary 5-wave impulse wave, waves 1, 3, and 5 are the motives, and 2 and 4 are the corrective waves. In the 3-wave pullback or ABC, all 3 of these waves are corrective.
The three golden rules for identifying the 5-wave impulse
Three golden rules first need to fulfilled to validate each wave:
- Wave 2 can’t pass the start of wave 1.
- Wave 3 can’t be the shortest impulse wave (as it’s always the largest of all waves generally).
- Wave 4 can’t overlap with the price territory of wave 1.
Identifying the waves
Traders need to be well-versed with the Fibonacci tool since this is the only method to be as accurate with the wave count as possible. The 5-wave impulse has its precise Fibonacci retracement or extension values.
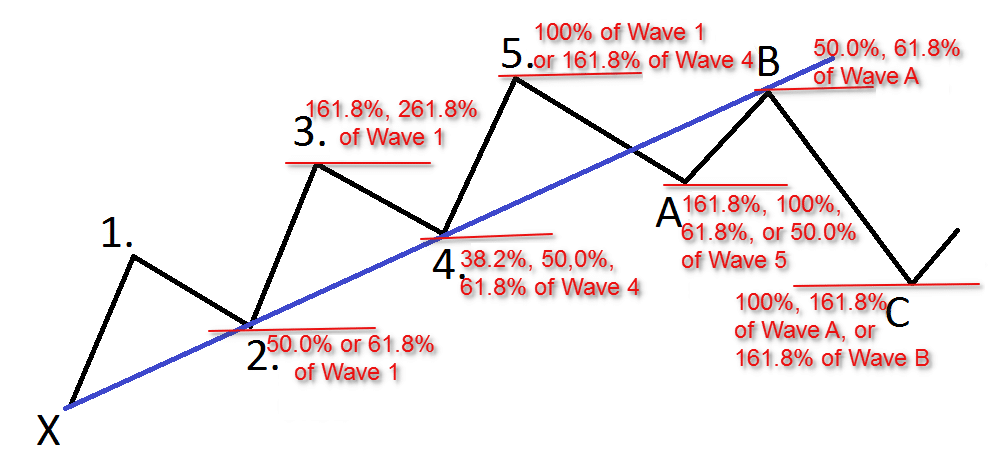
For identifying the 5-wave impulse:
- Wave 2 is roughly 50% or 61.8% of wave 1
- Wave 3 is roughly 161.8% of wave 1
- Wave 4 is roughly 38.2%, 50% or 61.8% of wave 3
- Wave 5 is roughly 1.618% of wave 4. It can also be roughly equal to wave 1.
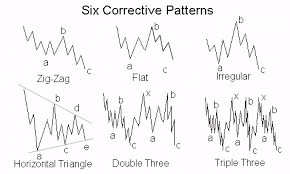
In contrast, the ABC or 3-wave pullback is more challenging to measure since the market usually doesn’t correct or consolidate in a simple 3-wave structure. There are primarily six corrective patterns; zig-zag, flat, irregular, horizontal triangle, double three, and triple three.
Trading with Elliott Waves
The Elliott Wave theory is not a standalone technical analysis theory. The main aim of using the principle is for one to know where they are in the bigger cycle. Enthusiasts speak of the wave cycles as a sort of ‘point on the bigger map.’ Traders can use a wide range of confirmations that back up the point at which they believe they are in the cycle. For example, if you were to pick trading Wave 5, asides from correctly identifying the wave, there would need to be other technical evidence that confirms the market may create wave 5.
Naturally, the motive waves (1, 3, and 5) are the most desirable waves to trade as they tend to be the most substantial legs of any trend. Also, they are the easiest to identify. Wave 3 is the most significant wave because it’s the most extended of them all. Waves 2 and 4, as well as the ABC pullback are much trickier to trade.
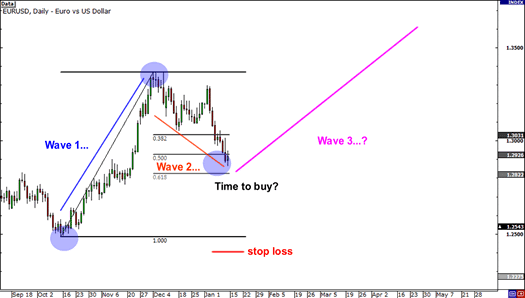
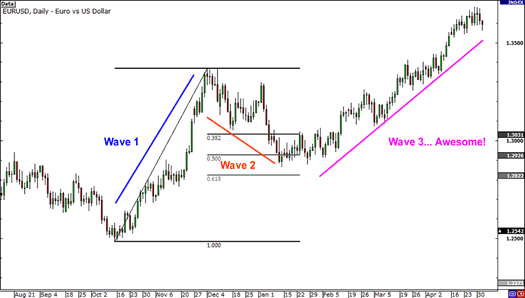
In the above images, let’s assume the trader has correctly projected waves 1 and 2. We should bear in mind that as with any prediction tool, we can get the wave count wrong. Thus, even if there is a strong conviction over the possible formation of a wave, we can only know if the wave was correct or not after some time.
Going back to the example, the trader may have anticipated the possible formation of the elusive wave 3 based on the Fibonacci retracement. The first golden rule of wave 2 never passing wave 1 would have been met in this scenario. Secondly, we know that wave 2 lands anywhere between 50% to 61.8% Fibonacci retracement of wave 1.
Now naturally, there would need to be other confirmation tools that confirm the market may be starting the wave 3. In and around the 50-61.8% area, the confirmations could range from price action and other patterns, other trend confirmations, fundamentals, etc.
After some time, the market rallied strongly from wave 2, confirming the wave 3. As stated, wave 3 is usually the most powerful, and this is evident on the chart. This example is the basis of trading any Elliot wave.
Conclusion
Understanding how to use Elliott Wave provides an advanced framework of technical analysis. Dedicated enthusiasts of the theory have studied and practiced trading with these waves for years due to their complex nature. Simplifying the approach involves understanding where one is in the bigger cycle when forecasting a particular wave. As with any analysis method, it cannot be used on its own, which means one needs many other confirmation tools that confirm where they believe to be in the wave cycle.


