Understanding the notion of S/R levels should be your first goal if you’re new to the market. Because many advanced methods rely on the basics of it. S/R usually forms around critical regions where price has repeatedly approached and rebounded.
What are resistance levels?
These are market sectors where the price has tried to rise but failed. The logic behind this is that sellers will be more willing to sell when the price approaches resistance and becomes more expensive, and buyers will be less likely to purchase. In such a case, supply (sellers) will outnumber demand (buyers), preventing price from breaking through resistance.
What are support levels?
Support zones are price sectors where the market has tried to fall but failed. These are critical levels because if the critical zone is not challenged, there is a significant risk that the price will break and continue lower. The logic is that when the price approaches the key level and becomes lower, as a result, customers sense a better offer and are more inclined to purchase. Sellers are less willing to sell because they are getting a worse bargain. Demand (buyers) will outnumber supply (sellers) in that circumstance, preventing the price from going below support.
What are the types of S/R?
Fixed S/R
These are set levels of S/R that cannot be changed. Only if prices break above or below them will they be invalidated. Fixed S/R levels include psychological levels such as round numbers or past significant price points, for example, all-time highs and lows.
Dynamic S/R
As the name implies, these are S/R levels that fluctuate when the price and time change. Prices are now vulnerable to new demand and supply dynamics at these levels. As the price and time vary, technical indicators produce dynamic S/R levels.
Semi-dynamic S/R
S/R levels that are semi-dynamic alter when time and price change, but at a defined or predetermined rate. Trendlines and Pivot points are two indicators that plot semi-dynamic S/R lines. As time and price fluctuate, these indicators depict S/R lines that shift systematically.
How can one find S/R levels in the market?
Fibonacci Levels
There are two methods to utilize the Fibonacci indicator. When a moving market is retracing, we use Fib retracements to identify the best entry positions, while Fib extensions help traders identify the most optimum target points.
Fib retracement lines serve as support lines in an upswing and serve as resistance lines in a decline. Fib extension lines, on the other hand, will operate as resistance lines in an uptrend and support lines in a fall.
Pivot points
The Pivot Points indicator calculates multiple lines from the open, high, low, and closing prices to function as S/R levels in the market. The indicator shows seven lines: one pivot point (PP), three support lines (S1, S2, and S3), and three resistance lines (R1, R2, and R3) (R1, R2 and, R3). A support line becomes a resistance line when it is breached, and vice versa. For example, if the asset price surpasses R1 during an uptrend, the line will now operate as support.
Trendlines
Technical analysis is built on the foundation of trendlines, which may assist traders trade with the market. In an uptrend, a trendline is drawn from one low to another, linking higher lows and projecting the line into the future. After that, the line serves as semi-dynamic support.
Peak and troughs
This is the simplest method for determining S/R levels. Simply draw visible highs and lows on your chart; higher highs and lower highs will act as resistance, while lower lows and higher lows will act as support., These lines should always be drawn on longer durations to have dependable S/R levels.
S/R strategies
Breakout strategy
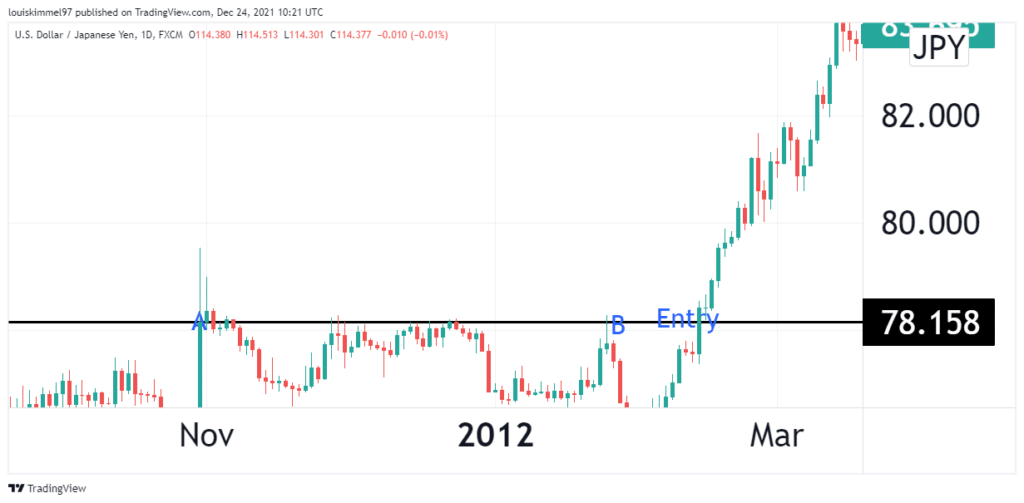
It is common for prices to break out and begin trending after a period of directional ambiguity. Traders frequently watch for such breakouts below support or above resistance in order to profit from the momentum’s continued increase in one direction. This momentum has the ability to launch a new trend if it is strong enough. It is advisable to wait for a pullback (towards support or resistance) before committing to trade in order to avoid falling into the trap of trading the false breakout.

The black line in the USDJPY price chart above is a strong resistance level in the chart above before buyers pushed the price above the resistance. It is not advisable to enter the trade at point A but wait for the breakout to be confirmed, as in point B. Enter the trade after point B.
Using Moving Average (MA) as a key S/R level
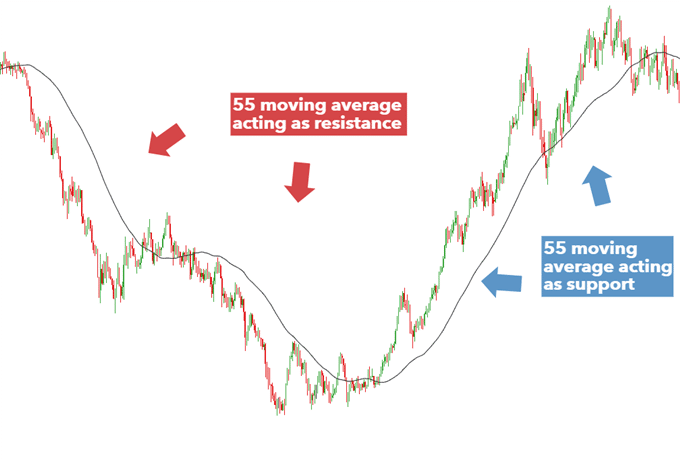
MA can act as dynamic support and resistance in the market. The 20 and 50-period Moving Averages, which may be significantly modified to 21 and 55 period Moving Averages to employ Fibonacci values, are popular tools to include. Traders frequently use the 100 and 200 MAs, and it is ultimately up to the trader to pick a level that they are comfortable with.

In the chart above, the 55 MA first tracks above the market as a line of resistance in the chart above. The movement then bottoms and reverses, with the 55 MA serving as a dynamic support. Traders may use trendlines to determine which markets are likely to continue trending and which are prone to a breakout.
Range trading
This is a method for sideways markets. Prices tend to bounce between regions of S/R in these markets since there is no noticeable trend. In a sideways market, the essential premise is that there is a visible high where increasing prices will encounter resistance and turn lower, and a visible low where rising prices will discover support and turn higher. As a result, the approach is to search for buy trades when prices are near the support and sell trades when prices are near resistance.
S/R levels are pricing zones, not price points. As a result, it’s critical to choose the best entry and exit points to limit risk and maximize profit possibilities. S/R levels can be used with other indicators to achieve this. For example, when the ADX indicator is below 25, it can be used to establish that a market is genuinely range-bound.
Conclusion
Technical analysis relies heavily on support and resistance lines. There are three types of S/R: dynamic, semi-dynamic, and fixed. One can identify S/R levels using Fibonacci levels, peaks and troughs, pivot points, and trendlines. The S/R approaches include breakout and range trading, as well as using Moving Average as a key S/R.


