It is almost impossible to day trade without using charts. That’s why all trading companies provide charting tools like MetaTrader, NinjaTrader, cTrader, and TradingView, among others. These platforms come loaded with tools that help people annotate charts and identify entry and exit points, and support and resistance levels. In this article, we will look at the best chart annotation tools in forex trading.
Fibonacci retracement tool
A Fibonacci retracement is a tool that many traders and investors use to identify potential support and resistance levels. The tool is based on the ancient mathematical calculation known as the Fibonacci sequence. By default, the tool has several lines that start at 0% and end at 100%. Between these are 23.6%, 38.2%, 50%, 61.8%, and 78.6% levels.
To add the retracement in a chart, you first need to look at it visually and see whether it is applicable. Ideally, a chart needs to have major upper and lower swings. Also, it needs to be in an upward or downward trend. As you will find out, the Fibonacci does not work well when an asset is consolidating.
After identifying the higher and lower swings, select the Fibonacci retracement tool and connect the two levels, as shown below. As you can see, the price tends to find some strong resistance or support the key retracement zones.
On the chart, we also see that as the dollar index was rising, it started to drop on March 2 and found support at the 61.8% retracement level at $90.63. It then rebounded and resumed the previous upward trend. On the other hand, if the price moved below this retracement level, it would have flashed signs that bears were back.
Fibonacci retracement example
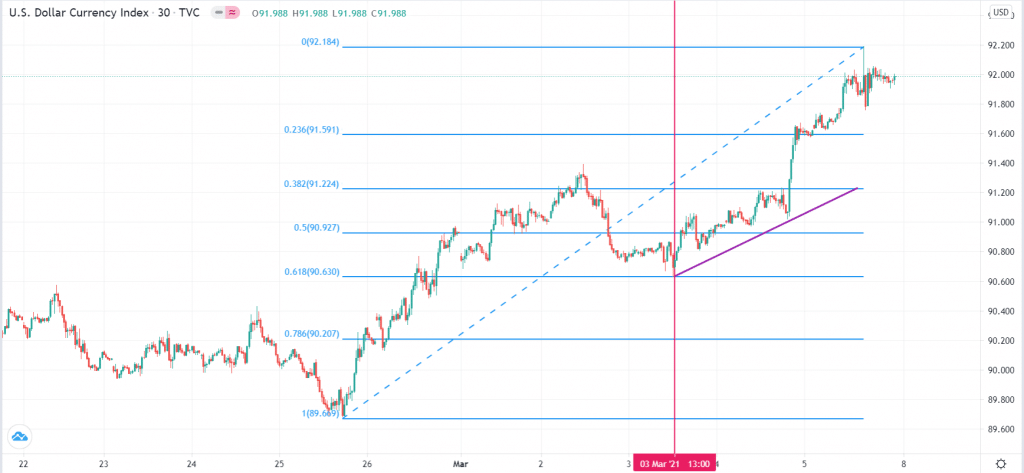
While the standard Fibonacci retracement is the most popular tool, there are other variations to it. There are the Trend-Based Fibonacci Extension, Fib Speed Resistance Fan, trend-based Fibonacci Time, and the Fib Time Zone. These tools are not popular, though.
Andrews Pitchfork
The Andrews Pitchfork is another annotation tool used in forex trading. It is provided as an in-built tool in most trading platforms like the MT4 and TradingView and is popularly used to identify key levels of resistance and support. The tool was developed by Alan Andrews.
Pitchfork has five key lines. It has a middle line and two upper and two lower lines. The upper lines are the levels of resistance, while the lower lines are support levels.
To draw the pitchfork, you need to identify a chart that meets the criteria. It needs to be trending upwards or downwards. Also, it needs to have had a pullback during this process. Therefore, to add this tool, you just need to select it and place it on the lower side. After this, you should drag it to the first resistance level and the lower side of the pullback, as shown below.
Andrews pitchfork example
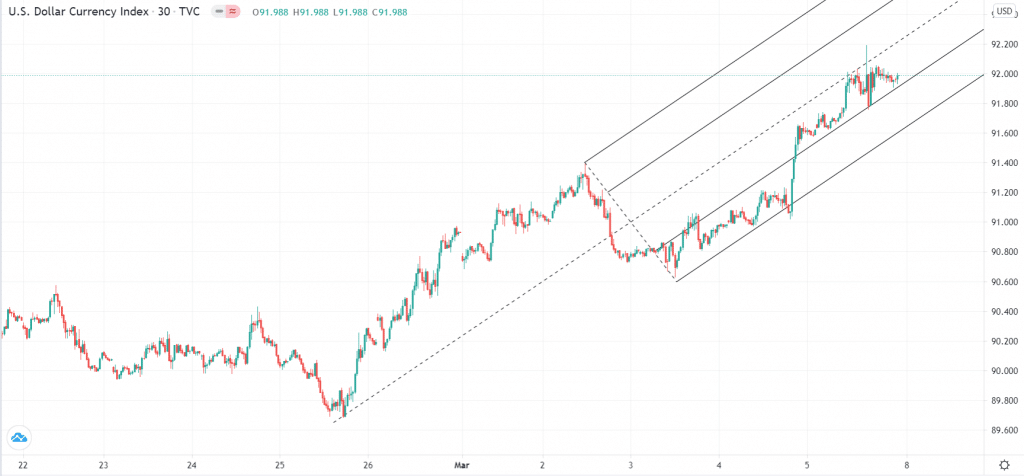
Using the pitchfork is relatively easy. You simply pay close attention to where the price is in relation to the support and resistance levels. For example, if the price is rising and it crosses the first support level, it is a sign that bulls are gaining momentum and that the price will continue rising. However, this bullish thesis will be validated when the price moves above the median line and continues to rise.
While the pitchfork tool can be used well separately, it is mostly more accurate when used in combination with other tools like the Fibonacci retracement and moving averages.
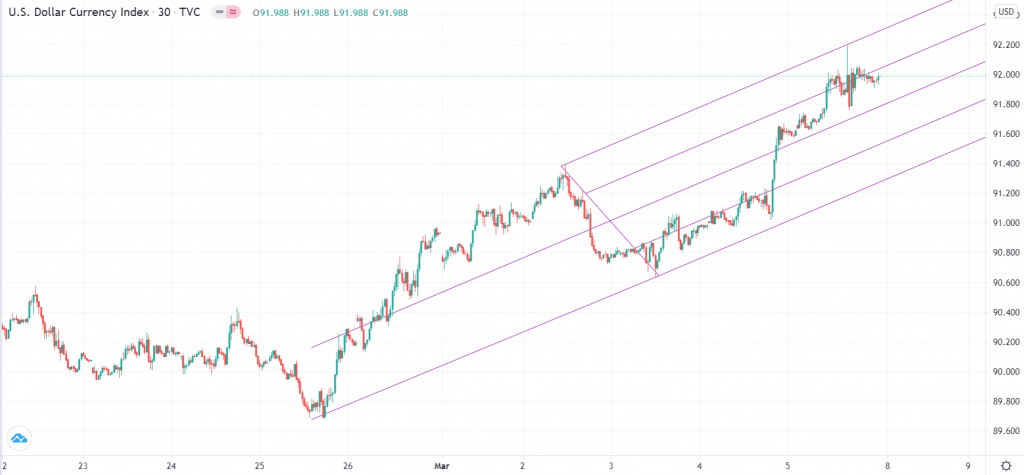
Like the retracement, there are other variations to the pitchfork. These are the Schiff pitchfork, modified Schiff pitchfork, and inside pitchfork. The chart below shows the Schiff pitchfork applied in the same chart shown above.
Schiff pitchfork example
Trendline
A trendline is one of the simplest annotation tools in the forex trading industry. It is simply a line that connects different levels in a chart. As a result, with it, you can easily spot the important support and resistance levels. To use a trendline, you just need to select it and connect the key levels.
For example, in the dollar index chart below, we have drawn an ascending channel by connecting the lower and upper swings. As a result, when trading, any move above the resistance or below these levels could be a sign of a break-out.
Trendline example
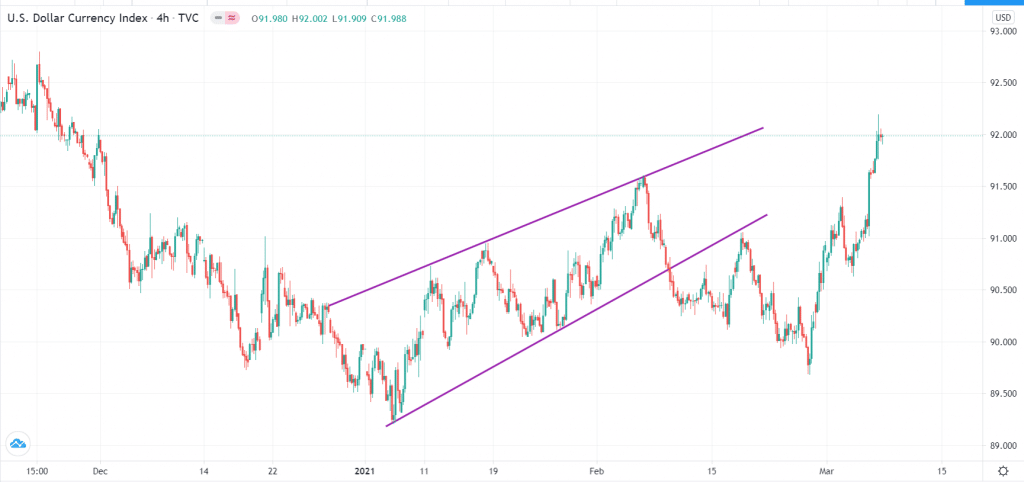
In most periods, it is possible to identify these levels visually. However, taking time to draw them can make it easier for you as a trader.
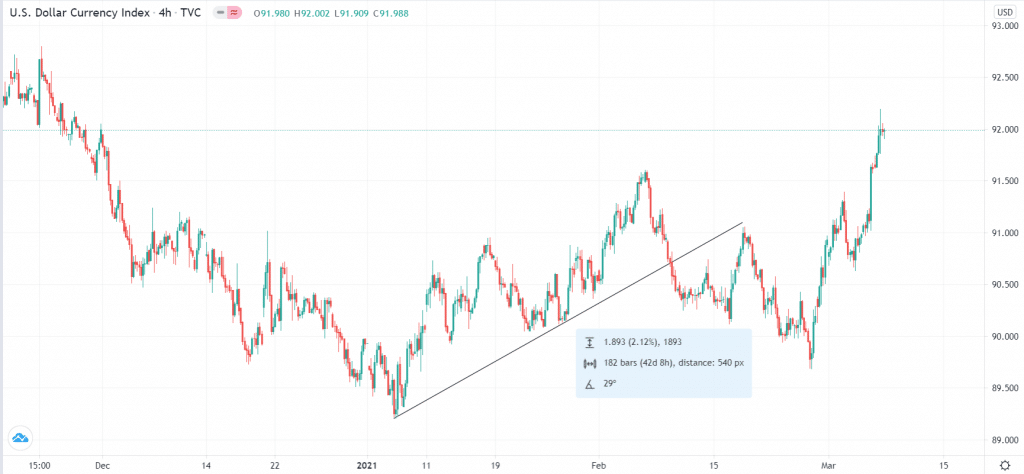
TradingView provides another detailed type of trendline known as an info line. This is similar to the ones used above, with the only difference being that it gives more details. For example, it shows the angle of the trend and the number of bars between the highest and lowest levels. An angle can be essential to some types of traders because it shows whether a trend is strong or not.
Trend info line
Other popular types of lines that you can use to annotate are the anchored VWAP, trend angle, ray, and extended line.
Note tools
Many trading platforms also provide tools to help you take notes in a chart. TradingView has several of these tools, which include:
- Text. This tool helps you to simply write on a chart. For example, you can write where you bought an asset or sold it.
- Note. This is similar to text, and it helps you write a note in a chart. You can use this note for future reference.
- Balloon and callouts. These are modified types of text that also help you to remember items.
- Arrows. You can also use up, down, left, and right arrows in the forex.
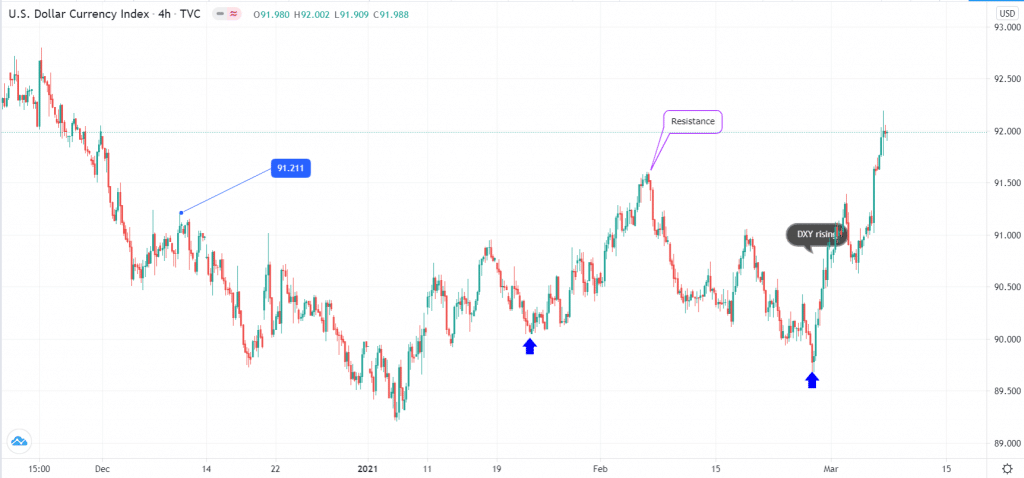
The chart below shows a chart with several text annotation tools.
Annotation tools
Summary
Annotation is an important part of forex trading. In this article, we have looked at some of the most common tools you can use to do this annotation in the forex market. We recommend that you start practicing more when using them.


