Forex robots are software that helps traders automate their processes. A bot can scan tens of currency pairs, identify patterns, and initiate trades. Other types of bots are created to help traders by sending them signals when certain patterns emerge.
For example, a bot can send you a buy signal when the Relative Strength Index (RSI) moves to the oversold level. This article will look at some of the worst technical indicators to use when building a robot.
The role of technical indicators in robot development
Technical indicators are tools that help traders analyze charts and identify potential entry and exit points. There are several types of technical indicators that you can use to trade. First, there are trend indicators that tell you whether there is a trend and how strong it is. Examples of these indicators are Moving Averages and Bollinger Bands.
Second, there are oscillators that tell you the momentum of a forex pair. The most popular ones like the Relative Strength Index and Stochastic Oscillator are known for identifying overbought and oversold levels.
Third, there are volume indicators that give you more details about the money flow in forex and other currencies like the volume Relative Strength Index and Ease of Movement index. There are also breadth indicators like the Arms index and the advance-decline ratio.
Most of these indicators are useful in both manual and automated trading. Still, some of them serve little purpose to robot developers. Some of these are listed below.
Parabolic SAR
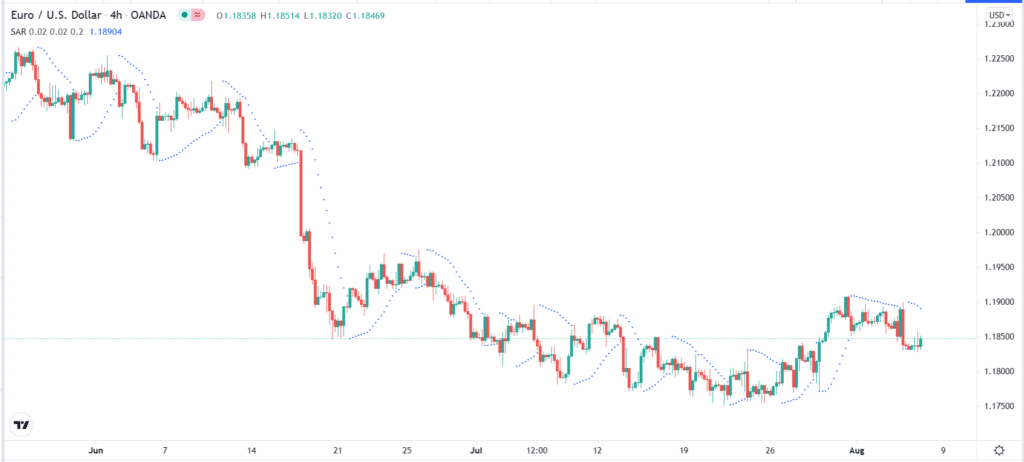
Parabolic Stop and Reverse (SAR) is a relatively popular trend indicator that is provided by most trading platforms like MT4 and TradingView. The indicator is easy to identify since it appears like dots that move up and down the financial asset. It was developed by Welles Wilder, a popular developer who also built the RSI and the ATR indicators.
Many forex traders use the Parabolic SAR to identify buying and selling locations. They also use it to identify key stop-loss and take-profit levels. The only settings to include when adding the indicator on a chart are the start, increment, and maximum value. The default of the three is 0.02, 0.02, and 0.2, respectively.
The most popular approach of using the indicator is to identify levels to add stop-loss and take-profit. That’s because it is relatively difficult to identify entry and exit targets using the indicator.

Therefore, most robot developers shun the indicator because of how difficult it is to identify these signals. For one, there are no overbought and oversold levels. It is also relatively difficult to combine it with other indicators like Moving Averages and the RSI. Therefore, we recommend that you only use the Parabolic SAR in manual trading.
Commodity Channel Index (CCI)
The CCI indicator was built by Donald Lambert, who was a professional in the commodities industry. As such, he built the indicator with a focus on the commodities industry. However, today, the indicator is used to analyze all assets, including forex and stocks.
When applied on a chart, the CCI indicator has an overbought and oversold level. By default, these levels are usually at 80 and 20, respectively. The indicator then has a line that moves up and down. It is considered to be in the oversold level when it moves below -100 and overbought when it rises to +100. The traditional approach is to buy when the indicator drops and sell when it rises to the oversold level.
While the indicator is used by many professional traders, I have found it to be relatively inaccurate whether you are day training or swing trading. It is not uncommon for the indicator to move sharply lower when the price is either consolidating or moving upwards.
Therefore, programming it in a robot or expert advisor is not recommended because it will often provide the wrong signals.
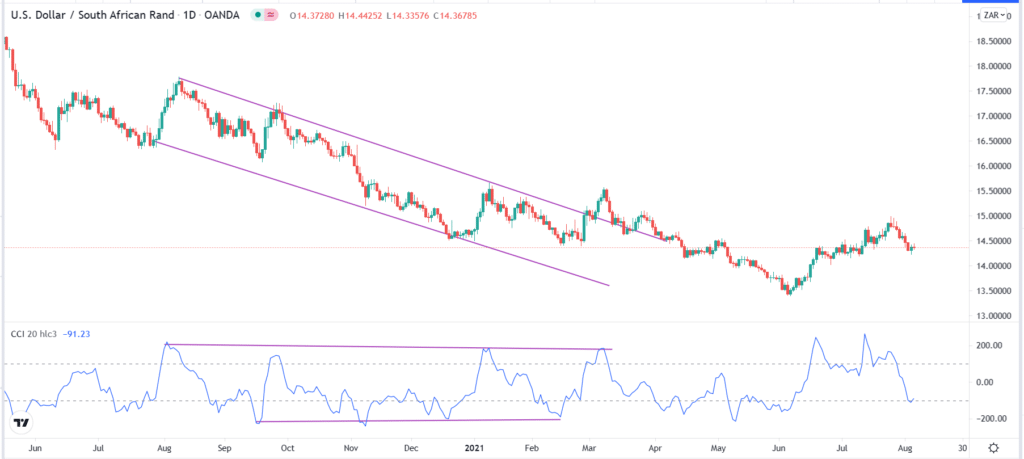
A good example of this is shown in the USD/ZAR chart below.
While the USD/ZAR is in an overall bearish trend, the CCI indicator’s movements are not in sync with it. At times, the CCI falls when the pair is rising and rises when the pair is falling. Therefore, setting “if this, then that” parameters on a robot using the CCI indicator is relatively difficult.

As such, it is one of the worst indicators to use in bot development.
Force Index
The force index is a relatively unknown indicator that was suggested by Alexander Elder. Elder is one of the best-known forex writers who have sold thousands of copies. He suggested the force index in Trading for a living.
The indicator is a relatively simple one to understand. It is derived by first calculating the 1-period force index by subtracting the previous day’s close with today’s close and then multiplying by the volume. The index is then calculated by plotting an Exponential Moving Average of the index.
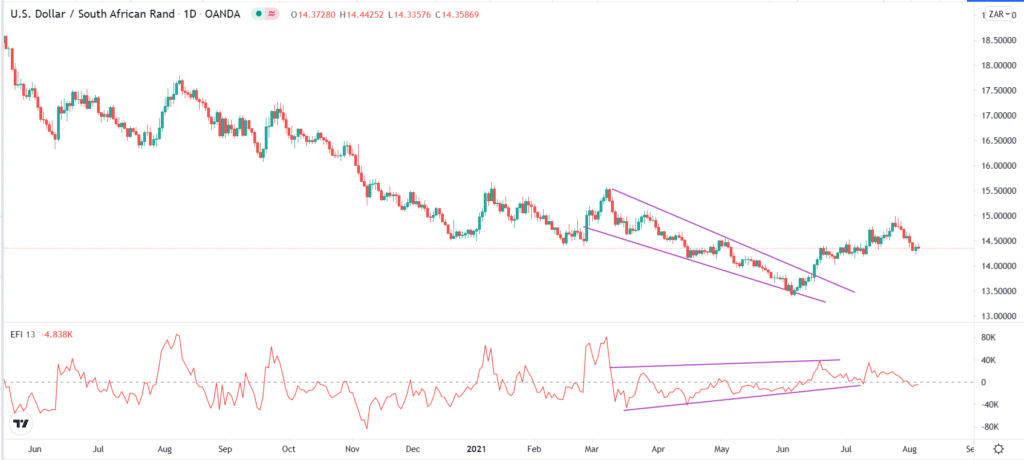
When applied in a chart, the indicator is seen as a line that moves up and down. According to Elder, the indicator can be used to identify divergences, corrections, and trends. However, in my experience, the Force index is not a good indicator for both manual and algorithmic trading.

As you can see above, the indicator is trending upwards when the USD/ZAR pair is in a downward trend.
TRIX Indicator
The TRIX indicator is the short-form of the Triple Exponential Smoothed Moving Average (TESMA). It is calculated by first calculating the Single-Smoothed EMA of the closing price. You then calculate the double and then triple-smoothed EMA. The TRIX is then the 1-period percentage change of the Triple-Smoothed EMA.
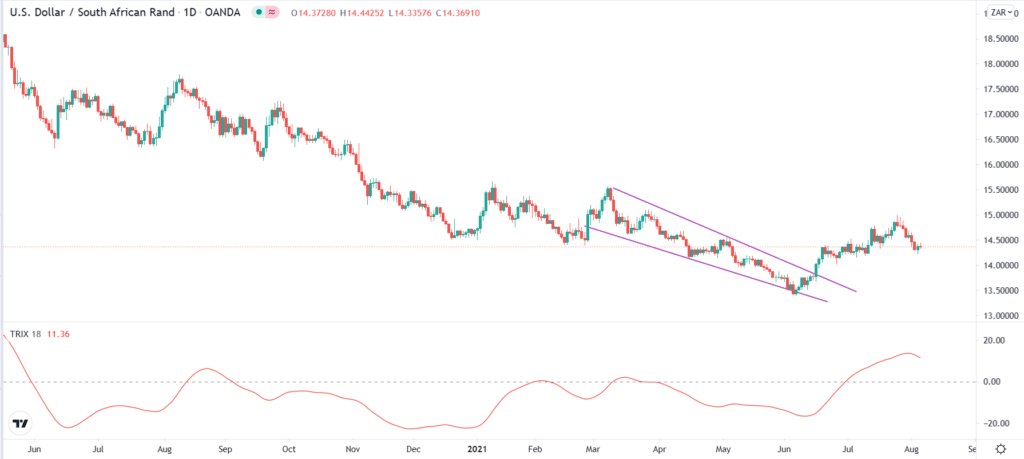
When applied in a chart, the indicator appears like a line that moves up and down. There is a neutral level at the center of the indicator. Therefore, in manual trading, you can use it to validate a trend and even to find overbought and oversold levels. In most cases, the indicator will decline when the price is falling and rise when it is rising.
TRIX indicator chart

It is a good indicator to use when trading manually. However, it is almost impossible to use it for building an expert advisor.
The indicator’s oversold and overbought levels do not necessarily hint that a pair will reverse, unlike other oscillators. As shown above, the price maintained its bearish trend even when the TRIX indicator was at the oversold levels.
Summary
Building a trading algorithm from scratch is not easy, especially for people with little experience in coding and trading. It is also more difficult when you are using the wrong technical indicators. Therefore, for most traders, we recommend using indicators like Moving Averages, ADX, RSI, and MACD indicators.


