The reversal trading approach is one that attempts to identify areas where existing trends end and start forming new ones. A falling reversal happens when the price of an asset starts falling after a period of rising. Similarly, a rising reversal happens when the price starts a new bullish trend.
Identifying reversal pivots is a popular approach that slightly differs from a trend-following strategy. With the latter, traders aim to join already-formed trends. In this article, we will look at some of the top technical indicators to help you trade reversal situations.
Moving averages
Moving averages (MA) are common indicators that show how a currency pair has been trading in a certain period. For example, if the EUR/USD is trading at 1.1200 and the 15-day simple moving average (SMA) is at 1.1100, it means that the price is significantly above its range in the past two weeks. Similarly, if the SMA is at 1.1350, it means that the price is below its past two-week range.
There are several types of MAs, such as exponential, smoothed, and weighted. These averages approach the calculation of the moving average differently. For example, while the SMA looks at the entire period equally, the EMA puts more weight on recent data.
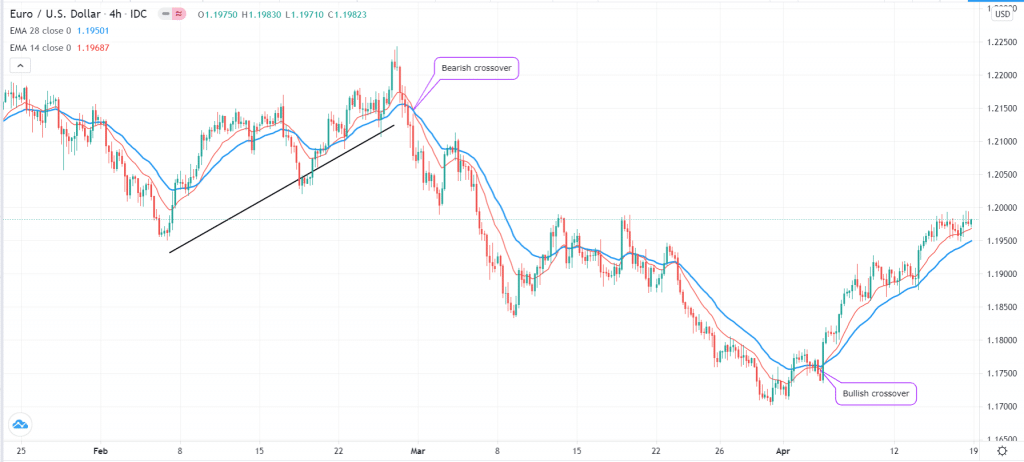
MAs are essential trend following indicators. However, they can become handy in trading reversals when used well. A popular way of doing this is to use a fast and slow-moving average in the same chart. For example, you could combine a 14-day and 7-day moving average in a chart. A reversal pattern happens when the two make a crossover.
On the left side below, we see that the pair was previously tilting higher. The reversal was confirmed when the 28-day and 14-day moving averages crossed over. On the right side, we see a reversal was confirmed when the two averages crossed each other.
MA crossover example

Moving average convergence divergence (MACD)
It is a tool that is calculated from MAs, which are trend-following indicators. It is created from two exponential moving averages, often twelve and twenty-six-day MAs, and is then smoothed by another figure, often 6.
There are three popular ways of using it in reversals trading. First, traders look at the location of the two MACD lines and attempt to predict where the price will move to next. If the two strips are significantly below the neutral line, it can be said that the currency pair has gotten undervalued or oversold. In this case, it points to the fact that a new bullish trend is about to start.
On the other hand, if the lines are significantly above the line, it can be said to be significantly overbought and lead to a bearish crossover.
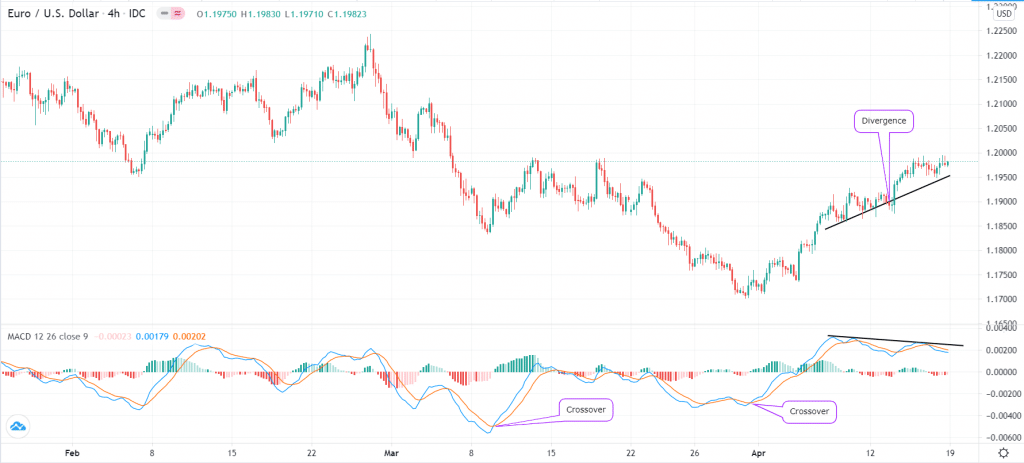
Second, many day traders use it to find crossovers. In this case, when the fast and slow-moving averages cross one another, it can be said to be a sign of reversal. If it happens above the price, it is usually a bearish reversal and vice versa.
Finally, as the name suggests, you can use the MACD to find divergences. In trading, this happens when the price is going on one side while the indicator is going on the other. For example, if the price is rising while the two lines of the MACD are falling, it could be a sign of a potential divergence. The chart below shows the MACD used to identify bullish reversals and divergence on the EUR/USD pair.
MACD chart

Stochastic Oscillator
A Stochastic Oscillator (SO) is a technical tool that was suggested by George Lane. Unlike other popular tools, SO does not follow the currency pair price or volume. Instead, it follows the momentum. It has two lines, known as %D and %K, and overbought and oversold levels. The two are usually at 80 and 20, respectively.
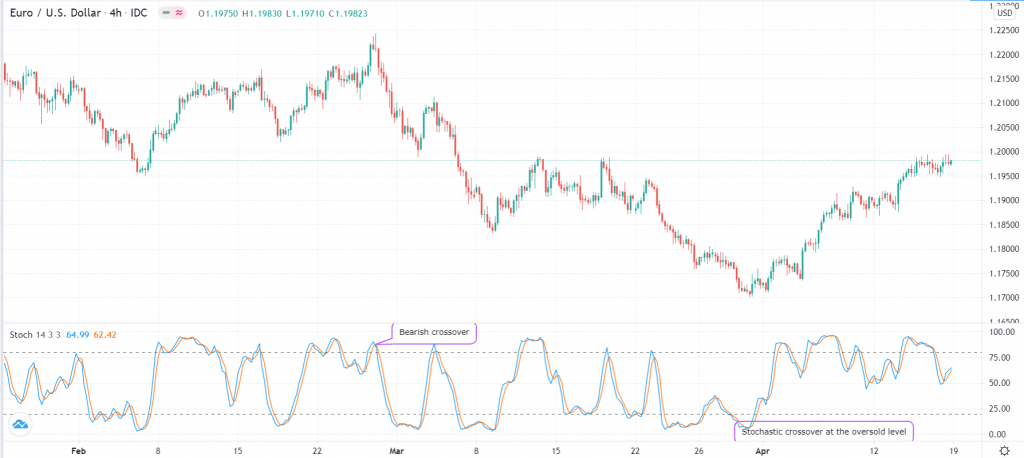
Like the MACD, the SO is widely used in trading reversals in three ways. First, it can be used to identify extreme levels. If the two lines of the indicator move substantially below 25, it could be a signal that a bullish reversal is about to take place. If it moves above 80, it could be a sign that the reversal is about to happen.
Second, it can be used to identify reversals when the two lines cross over. If they cross over at the oversold level, it is a sign that a bullish trend is about to happen, and vice versa. Finally, the indicator, too, can be used to find bearish and bullish divergences.
SO chart example

Relative Strength Index (RSI)
The RSI is a tool that is also used to show reversals in forex. It measures the speed of change of financial assets.
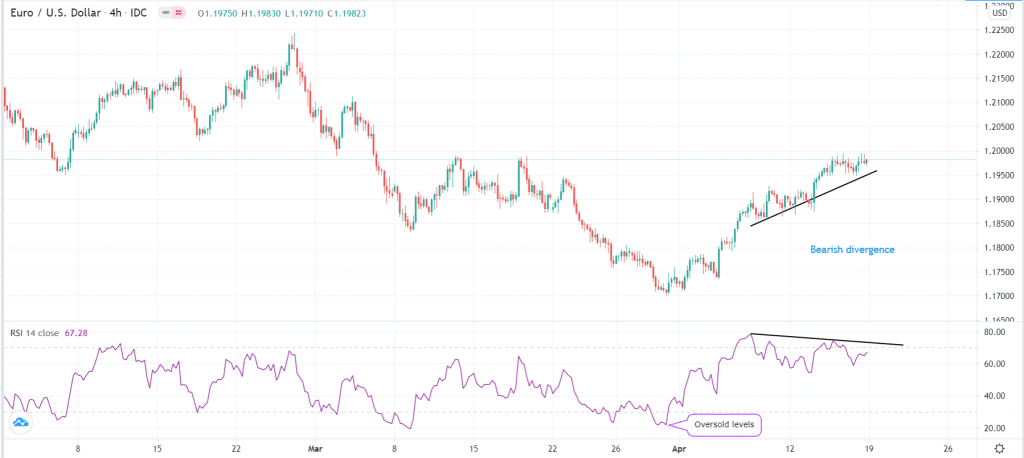
Like the other two oscillators mentioned above, the RSI can be useful to identify reversals. For example, when it falls substantially below 30, it means that the price is getting oversold and that it could rebound.
On the other hand, when it rises above 70, it signals that the price is getting extreme and that a bearish reversal is about to happen. The RSI can also be used to find reversals in the form of divergences. Here is an example.
Example

Final thoughts
Reversals, when used well, can be an ideal trading strategy. When they are identified early enough, the strategy can be more effective than the trend-following strategy. Further to the tools, we have looked at above, others that you can use to identify these patterns are the Donchian Channels, True Range, Money Flow Index, and the Awesome Alligator.


