Technical indicators are analysis tools that assist traders in studying the movement of asset values to determine if the current trend will continue or if a reversal will occur. Therefore, they aid traders in making judgments on when to enter or quit a particular asset class.
Technical indicators can either be leading or lagging indicators. Leading indicators try to signal the likely future price movement based on current trends. Conversely, lagging indicators look back to the past and show the market’s direction. We discuss common technical tools that don’t always get right in the crypto market.
Moving Averages (MAs)
Traders employ (MAs) to determine whether a trend is still in progress. MAs of 10, 20, 50, 100, and 200 periods are quite popular amongst traders. There are two types of trends: an uptrend, which occurs when the price moves above the MA, and a downtrend, which occurs when it moves below.
An MA can assist you in several ways to make better financial decisions. Below are among the most critical ones.
- Assessing the level of support: In general, an asset’s price trend is upward when it trades above its Moving Average. MAs, including 30-day, 50-day, 90-day, and 120-day averages, serve as critical support areas. Usually, when an asset reaches its resistance and reverses its direction, it tends to settle near its MA. Bearish breakouts occur when a value breaks below its MA, signaling that further falls are imminent.
- Determining the resistance level: An asset is in a downtrend if it is trading below its MA. Major MAs can serve as resistance points when a security reaches support and begins to rebound. A bullish breakout occurs when the asset price rises above an essential MA, indicating that further increases are likely.
- MA crossovers: When two MAs of distinct periods cross paths, they are called crossover points. There are times when the short-term MA crosses over the long-term moving average, indicating that the market may be poised for a substantial upward rise. In contrast, when the short-period MA crosses below the long-period MA, this is a bearish crossing and a predictor of more significant drops in the market.
The MA line is supposed to act as a support during an uptrend and as a resistance level during a downtrend. However, the relatively high volatility, FOMO, fear, and greed in crypto markets often lead to frequent instances where this rule does not apply, leading to false breakouts.
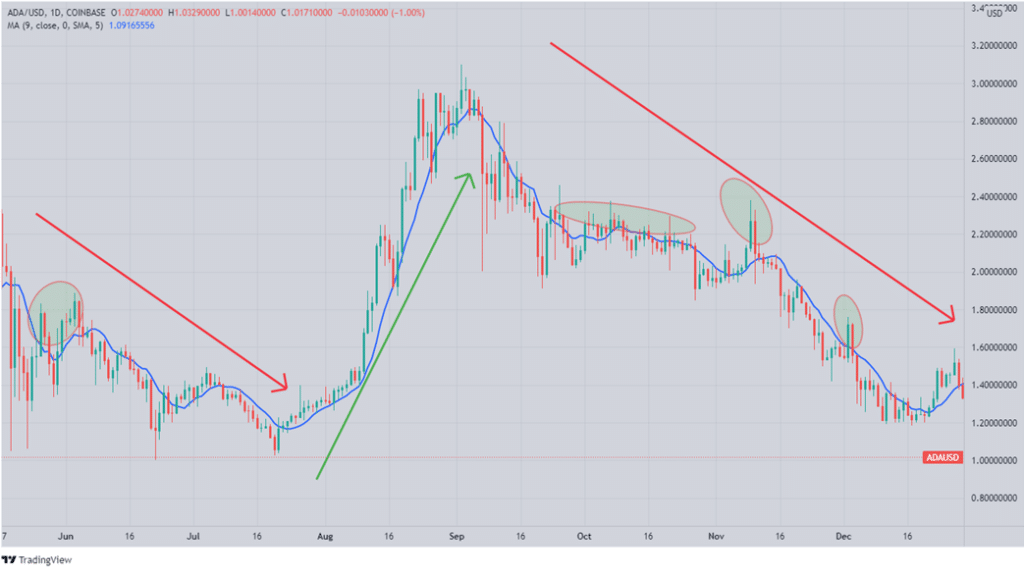
On the ADAUSD chart below, the areas indicated by green ellipses show instances where the price breaches MA’s support and resistance levels only to turn out to be false breakouts.
Relative Strength Index (RSI)
You can see whether a price is bullish or bearish in magnitude with the RSI. Put another way, you’d utilize RSI to detect if a price is overbought (70 or more) or oversold (less than 30). In a trending market, the momentum of price moves provides the signal to estimate the overbought/oversold through the RSI indicator.
In most cases, traders benefit from this signal because it helps determine entry points, trends, support and resistance, and other important aspects of trading. However, in the crypto market, the RSI often sends false signals, especially during extreme fear and greed.
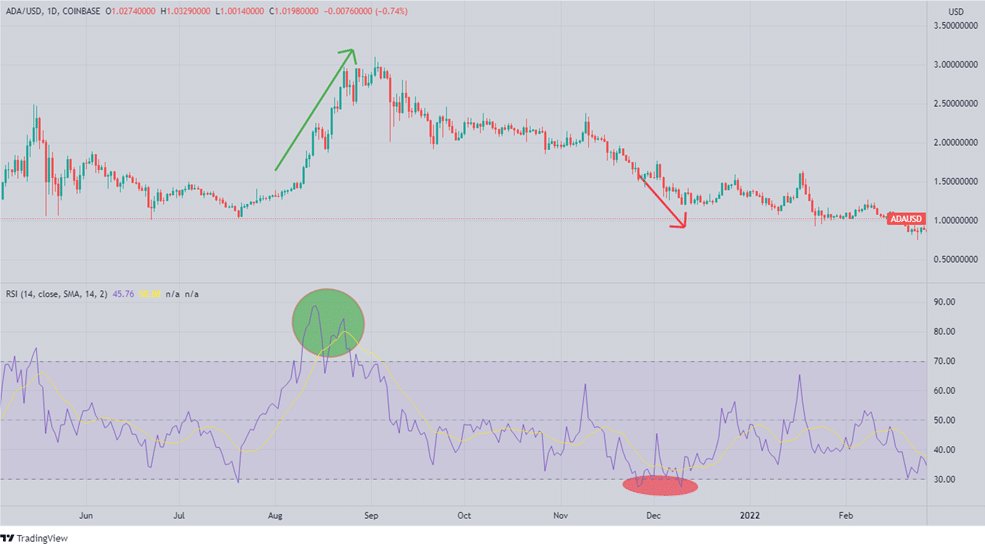
The chart above shows that the price uptrend continues despite the RSI is above 70, as shown by the green highlight. Similarly, the price downtrend continues despite RSI indicating oversold, as shown in the area highlighted in red.
Bollinger Bands
Using Bollinger bands, you can get an idea of where a particular asset’s price usually trades. The band’s breadth changes depending on recent volatility. However, the bands don’t indicate the direction in which a breakout will occur. On the contrary, it helps assess market volatility and where the most money exchange occurs. In other words, they let you know that a breakout is imminent. On the chart below, the BB does not narrow despite significant breakouts. This may lead to lost trading opportunities.
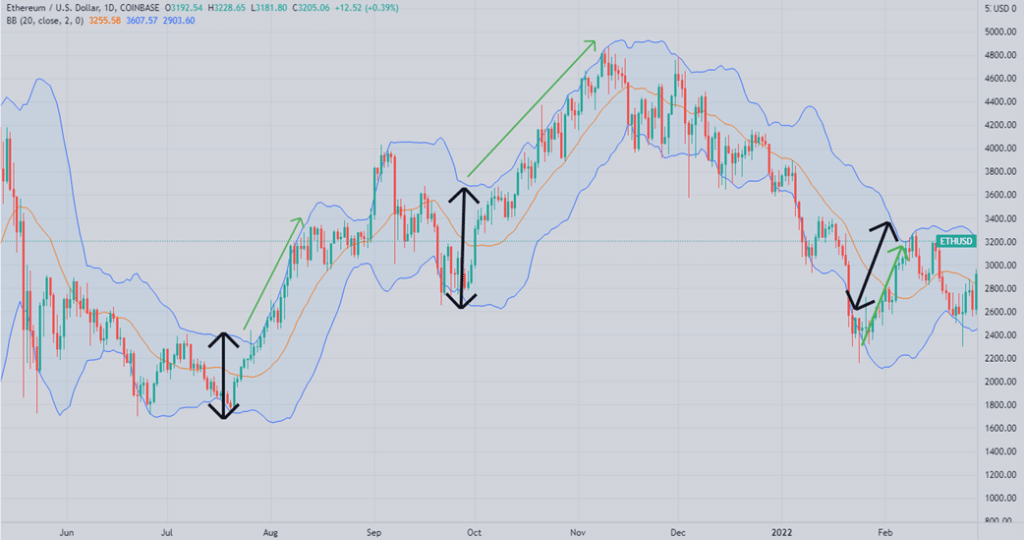
The past trades will serve as a reference point for when you want to buy or sell an asset at its peak or lowest point. Depending on how far apart the bands are, this will reflect how volatile the market is. The wider the bands, the more volatile the market is. The market is less volatile if the bands are closer together. However, the volatility of the crypto market is such that Bollinger Bands often misrepresent the market mood. In many instances, the BB will widen or become narrow without a corresponding response by the price.
Moving Average Convergence Divergence (MACD)
MACD is an indicator that compares two Moving Averages to detect changes in momentum. When trading near support and resistance levels, it can assist traders in identifying potential buy and sell opportunities.
“Convergence” refers to the convergence of two MAs; conversely, “divergence” describes the movement away from each other. There is a decrease in momentum when MAs are converging, while there is an increase in momentum when MAs are diverging.
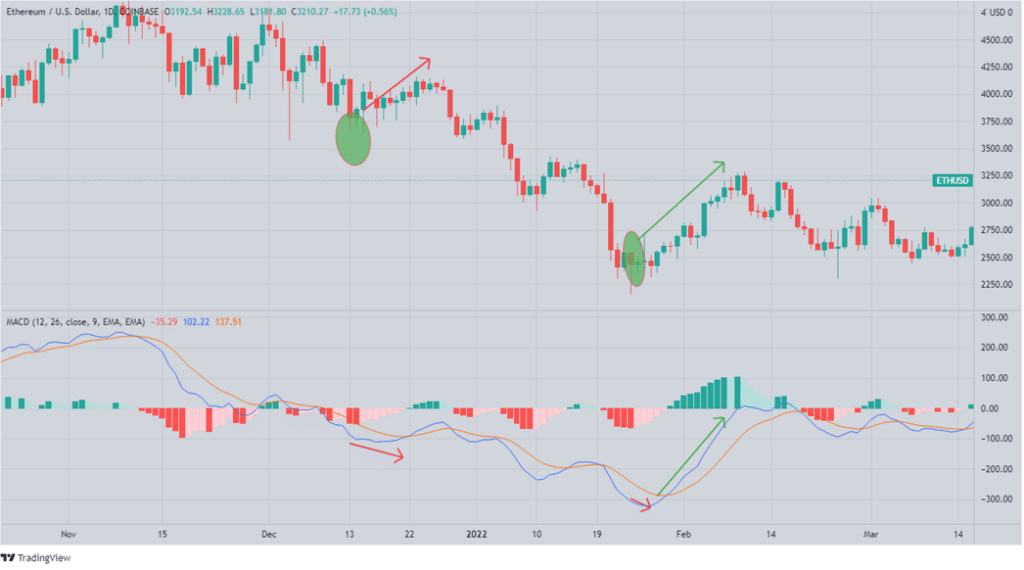
On the ETHUSD chart above, the MACD seems to lag behind changes in the price. In the areas shown by the arrows, the price and the MACD are incongruent, with the MACD taking time to react. This can lead to lost opportunities.
Average Directional Index (ADX)
Using the ADX, traders can see how strong a trend is. A reading above 25 indicates a strong trend, whereas a reading under 25 indicates a drift. Traders can use this data to see if an upward or downward trend will continue.
We obtain the ADX using a 14-day MA of the price range in most cases. ADX does not suggest how a price trend will develop. The Average Directional Index can climb when a price is declining, indicating a strong downward trend. The ADX often lags and fails to change direction when the price trend changes.
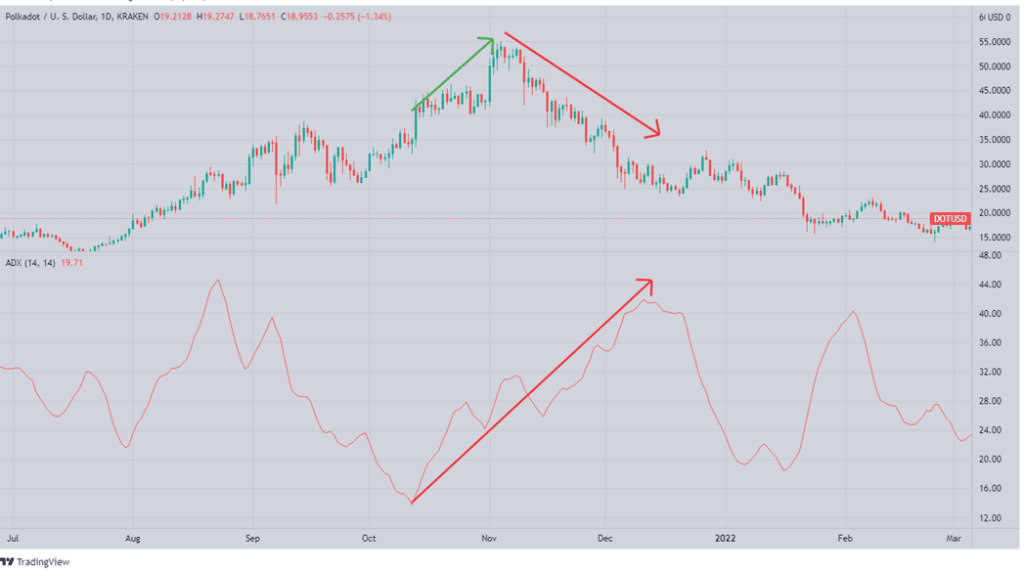
On the chart above, the price uptrend continues as the ADX rises from below 25 as shown by the green arrow. In the second instance, the price is on a downtrend, but the ADX doesn’t change its direction.
Fibonacci retracement levels
An asset chart’s Fibonacci retracement levels show where future levels of support and resistance are most likely to occur based on the asset’s price history. Fibonacci numbers are used to calculate the percentages on these lines, shown as 23.6 percent, 38.2 percent, 61.8 percent, and 78.6 percent, among other levels.
An uptrend can be broken by crossing one of the Fibonacci levels, and that level becomes new support, and the following one becomes new resistance. However, if an asset is dropping and breaks through a critical Fibonacci retracement level, the level it passes becomes resistance, and the level below becomes support. The crypto market does not always react to Fibonacci levels. The price may trigger a higher retracement during an uptrend, only for the price to head further south due to volatility.
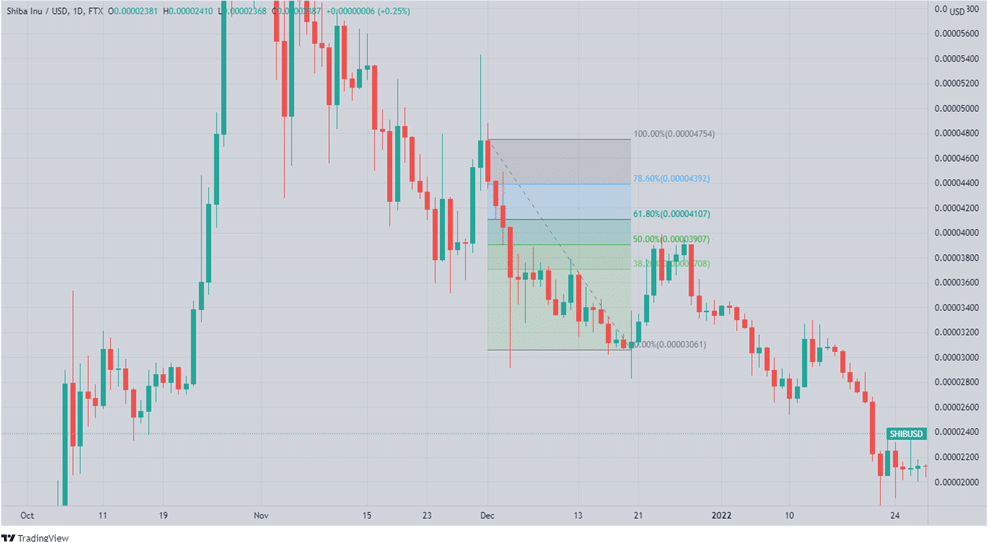
The chart above shows how the downtrend continues uninterrupted with no notable price action shifts at 78.6%, 61.8%, 50.00% until the 38.20% Fibonacci retracement level, where there are minimal gains with sideways action.
On Balance Volume (OBV)
The idea behind utilizing this indicator is to identify instruments whose volume has increased dramatically but whose price has stayed relatively stable. Retail investors are expected to follow “smart money” (hedge funds and other institutional investors) into an asset if on-balance volume reveals substantial volume flowing. This might cause prices to go up.
A negative trend can be expected if, on the other hand, OBV reveals that volumes are large and pouring out of a security, indicating that both institutional investors and individual investors are taking profits.
Crypto traders (especially meme coin traders) tend to pay greater attention to market fundamentals such as institutional adoption of crypto, an endorsement by influential personalities, and FOMO. While they also analyze technical aspects, a factor such as traded volume carries significantly less weight in market analysis. Therefore, the OBV indicator may not help much in such instances.
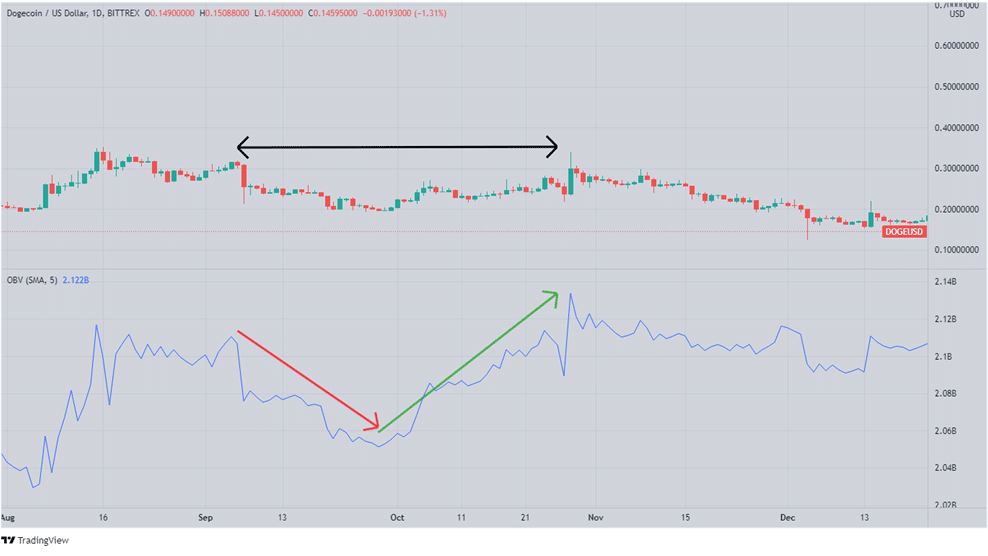
However, the OBV is often not in sync with crypto prices. On the DOGEUSD chart above, the price heads sideways despite the OBV indicator initially hitting lower highs and lower lows (red arrow), followed by higher highs and higher lows (red arrow).
In summary
Technical indicators can help traders understand patterns, average trading volume, and the price action of an asset. If used correctly, they can help you optimize your profits in the crypto market. However, you should never utilize an indicator in isolation, nor should you employ many indicators at the same time. Choose a handful that you believe is most suited to your goals. In addition, your personal evaluation of the market is of great importance, even as you use these indicators.


