Any information one gathers from one-off stories or by personal observation is Anecdotal evidence. While it may be fun to gather, it can also be unscientific and thus, often unreliable. There exists a wide range of anecdotal evidence that one can incorporate when they analyze financial markets. They can use the information either to establish new conclusions or to confirm any existing views they might have.

Dealing with anecdotal evidence when it comes to trading has some risk associated with it. This can include confirmation bias, sample size issues, and any other types of prejudice. This is because the anecdotes one chooses to focus on can be biased due to regional idiosyncrasies, the trader’s pre-existing views, or by other factors. However, the main advantage of anecdotal evidence is that they are logical and intuitive. They are observed in real-time and is easy to understand for traders. It can sometimes provide obvious proof of sentiment extremes.
Magazine Cover Indicator
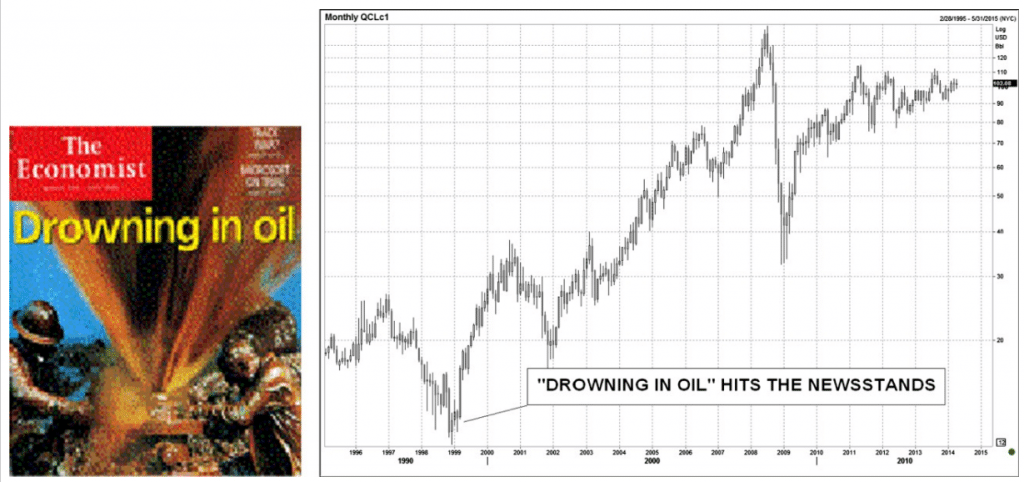
This is an anecdotal indicator which is quite logical, effective, and popular. As per this indicator, whenever a market theme or a financial story appears on a magazine cover, the trend or the theme is near exhaustion. It implies that the magazine covers are quite like reverse indicators. There are many examples of this indicator – “The Death of Equities” appeared on the cover of BusinessWeek. This was when the stock market hit a major low in August 1979. Later, again in 1999, the Economist published “Drowning in Oil” and soon oil bottomed that year.
One more popular example related to Magazine Cover Indicator is the featuring of Jeff Bezos as Time Magazine’s Person of the Year, in 2000. (Figure below) This was just before the tech bubble burst. Yet another example would be when President Vladimir Putin was featured as Person of the Year in 2007, which happened just before the Russian economy was taken down by the oil crisis.
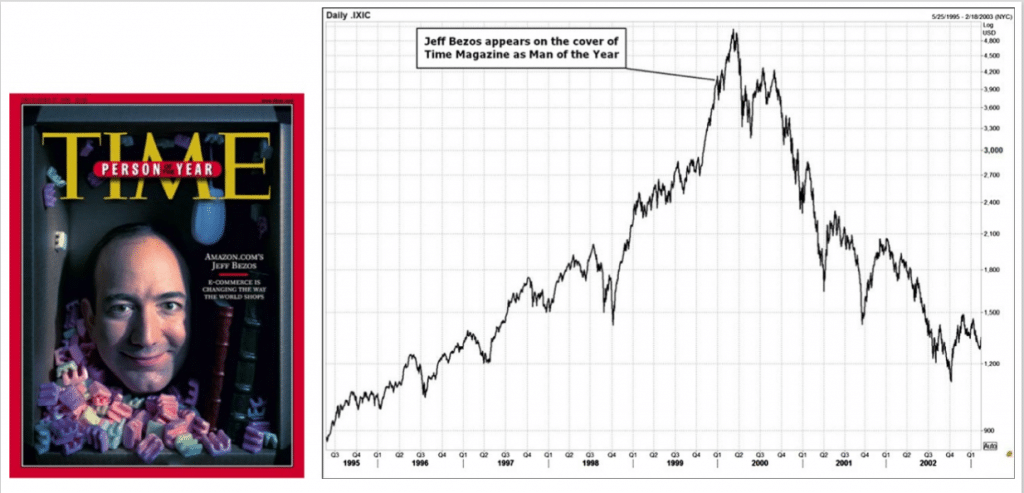
The idea behind his indicator is that as an editor or a journalist devotes a cover to a person, a country, a company or a trend, it indicates that the theme or the story has been in the market for quite some time and has already crossed its peak time. It means, as the magazine features the specific individual or trend, it is no longer some news.
Skyscraper Indicator
The Skyscraper Indicator indicates that when any country builds the tallest skyscraper of the world, it signifies its overconfidence and (to a certain extent) its impending financial crisis. Countries decide to build skyscrapers when the market is bullish, and credit is available in plenty. The building of a record-breaking skyscraper can be an indication of a downturn. There are several instances when countries built skyscrapers and they fell upon difficult times or have predicted a recession.
For instance, The Empire State Building was built in 1929 and then there was the Great Depression. The World Trade Center and Sears Towers, built-in 1972 brought along the 1970s stagflation. The Petronas Tower was built in 1997 and it brought in the Asian Financial Crisis. Skyscraper indicator does not create many signals, but its track record is quite strong and has predicted recession several times in the past.
The IPO Indicator
The IPO another indicator to check as a sign of a top in a particular industry or the complete stock market. The market absorbs a large IPO when there is a bullish sentiment and when the market is trading well. Companies do not go public if the market is weak as they need to sell shares at the highest price. IPOs are plentiful in the later stages of a bull market, as the company owners see a rise in market value. This is when they decide to cash out.
IPOs are smart money selling as people believed that the stock was quite cheap, and the company will grow largely – why would anyone sell?
One good example of an IPO indicator is related to Glencore when it sold its initial public offering. Glencore is popular worldwide for being the largest commodity producer. In 2011, there was a big bullish run in commodities – Commodity Supercycle. Commodity prices reached a new peak and investors were showing deep interest in anything related to commodities. This was when Glencore insiders realized that it was the right time to sell their company. It was valued at $60B.
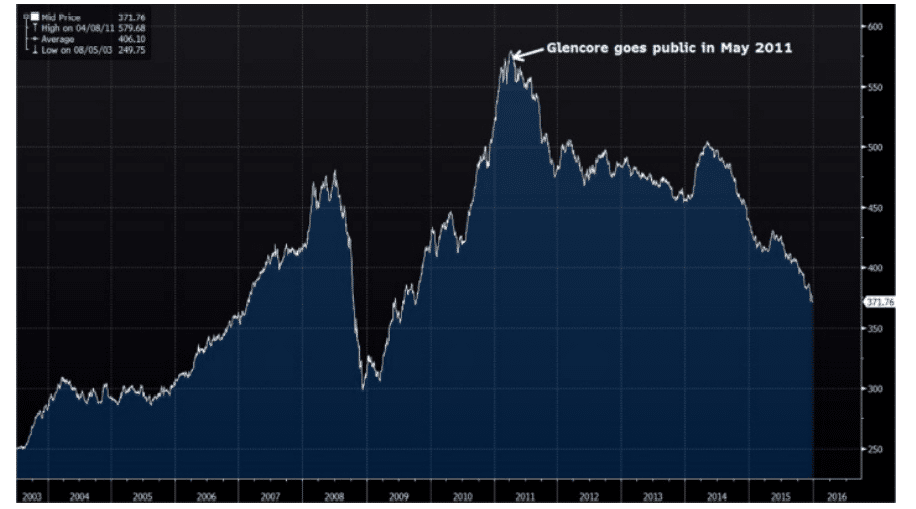
The above chart shows the Glencore IPO market on the chart of CRB. CRB refers to the benchmark commodities index. Glencore IPO market the top pick for commodity markets. “Monster IPOs” such as the one here does not happen regularly. But because it is powerful, traders should keep this indicator at the back of their minds in case they spot something similar in the future.
Conclusion
Anecdotal evidence is interesting and fun overall, and useful for traders to conduct big picture macro analysis. However, they should always be aware of the pitfalls. Contrarian anecdotes that some people put out to support their contrary view during strong trends do not work all the time. Traders should thus treat anecdotal evidence as less predictive yet fascinating input into their process. A successful example of anecdotal evidence is December 2017’s Bitcoin bubble. Most mainstream traders did not expect the cryptocurrency bubble to explode. However, there were some traders who mainly used anecdotal evidence to identify the absurdity of the bubble.
Traders preferring a more robust approach to using anecdotal evidence can collect data in numerous ways to avoid confirmation bias and sample size issues. For instance, traders can make a comparison by adding up the number of bullish articles and bearish articles on the front page of the Wall Street Journal. Sensible, natural language approaches like these are present in the current market scenario as well, such as extracting sentiment from Twitter and other social media news feeds.

