Technical analysis often involves spotting familiar chart patterns. This is because, in the forex market, particular patterns tend to play out in a similar manner almost every time they occur. For that reason, any trader with a working knowledge of said patterns can take advantage of their repetitive nature for profit. The measured move up is one such setup with a promising success rate.
Defining the measured move up
This chart formation usually manifests in three parts. The first is usually a bullish advance, which, more often than not, will be a reversal from a prior downtrend. The second part consists of a consolidation or a retracement of the initial bullish advance. Finally, the pattern culminates in a second bullish advance, which more or less equals the length of the initial rally.
Since this pattern cannot be confirmed until the second rally manifests, it is classified as a continuation pattern. What’s more, this pattern can stretch out over long periods of time, usually weeks or months.
The psychology behind the pattern
Traders may readily determine the direction and intensity of the current market trend using this pattern. The size of the retracement has a big impact on the trend’s strength. The retracement is the distance BC, as shown in the illustration below.
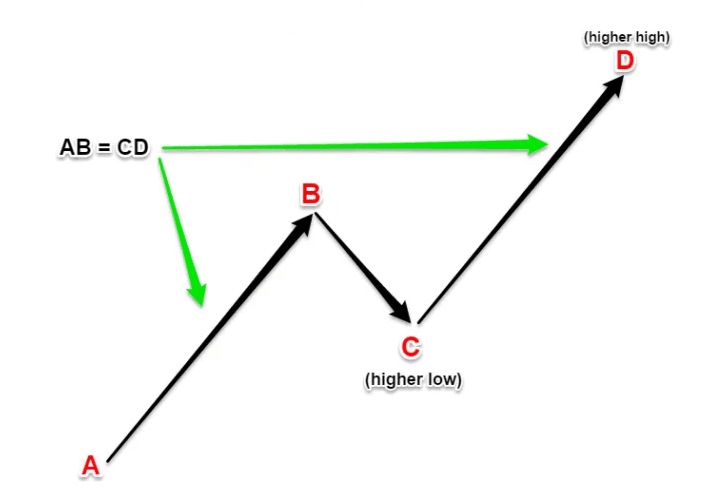
Fibonacci retracements may be used to calculate the length of a retracement. If the retracement rises over 50%, the upswing that follows is expected to be robust. If the retracement falls below the 50% fib retracement level, the upswing that follows is likely to be feeble.
How to trade the pattern
1. Identify a prior downtrend
As aforementioned, this pattern will more often than not be preceded by a downtrend. Therefore, this pattern begins as a reversal before shaping itself into a continuation pattern. The prior downtrend tends to vary in length, from a few weeks to several months. The measured move up can also be part of a larger bullish movement.
2. Identify the first reversal advance
The first leg of this pattern should be an uptrend, which begins at the low of the prior downtrend. The rally should have its candlesticks continually forming higher highs and higher lows. It is not uncommon to see the pattern begin with a break above resistance instead of a reversal from a downtrend. This uptrend is usually fairly orderly, and its peaks and valleys may form a price channel. At the beginning of this rally, the traded volume should experience a spike. This phase could extend for a few weeks or months.
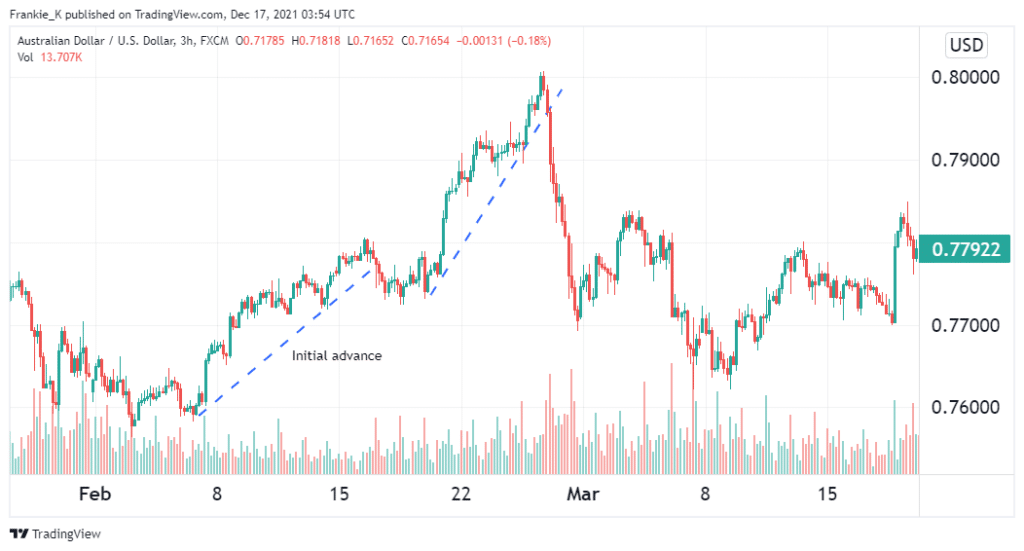
Looking at the example above, you can see the prior downtrend and how volume rose at the beginning of the initial advance.
3. Spot the retracement
A while after the first rally, a correction occurs. This correction may manifest as a consolidation or a brief downtrend. It may form a rectangle, triangle, or a descending flag pattern. A suitable correction should range between the 38.2% and 61.8% Fibonacci retracement levels. Typically, the bigger the initial uptrend, the bigger the retracement. A 100% advance may result in a 61.8% retracement, whereas if the initial uptrend was only 50%, the correction would likely reach the 38.2% retracement level.
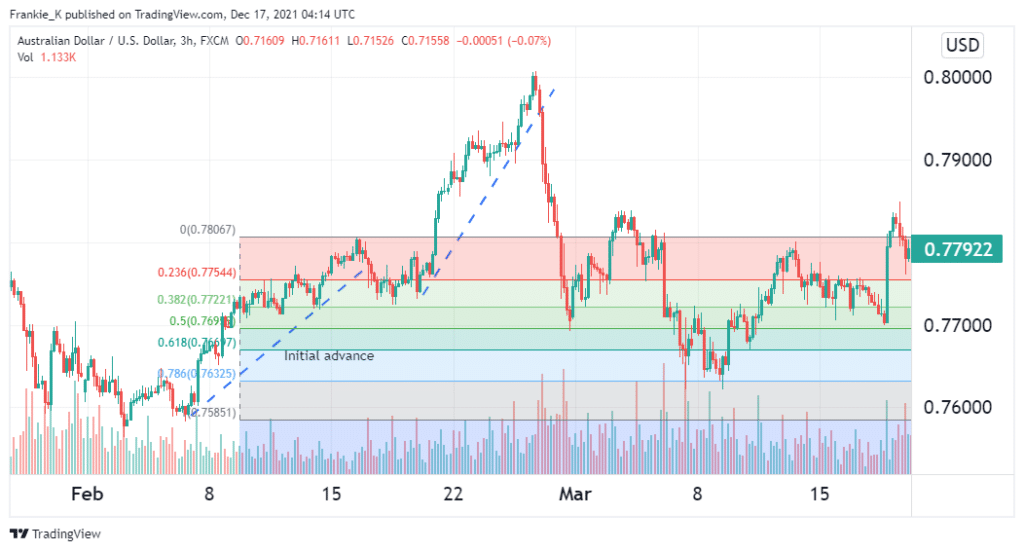
From the example above, you can observe the correction hit the 38.2% fib retracement level before embarking on the subsequent rally. After confirming the validity of the pattern thus far, the next step will be identifying a possible entry.
4. Identifying a suitable entry
For a conservative risk-taker, the best entry position for a long trade will be where the subsequent rally surpasses the swing high of the first uptrend. However, if your strategy is a little more aggressive, you may opt to enter your buy trade as soon as the second uptrend begins. This will increase your profit potential, but you will run the risk of trading an unconfirmed pattern. Similarly, waiting till the second rally surpasses the first may cut you out of a significant portion of your profits, thus qualifying as a late entry.
5. Setting your profit target
Typically, for the FX market, the length of the subsequent rally of the measured move up pattern is equal to that of the first rally. In other words, the first uptrend should be equivalent lengthwise to the second uptrend. Therefore, our profit target should be set at a distance equal to the length of the initial reversal from the end of the correction.
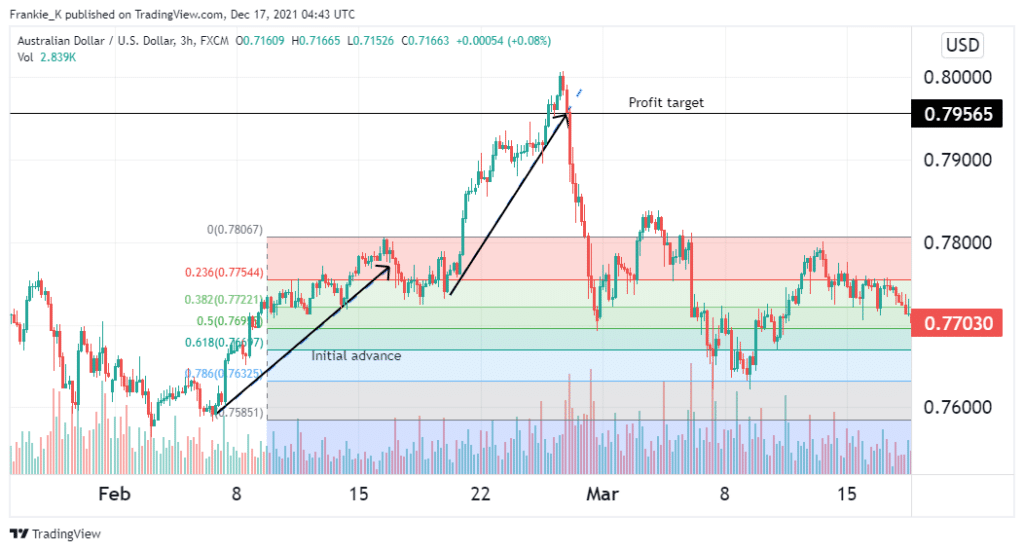
From the figure above, entering the trade at the beginning of the second rally would have yielded a profit of approximately 220 pips. Alternatively, if we used the conservative strategy and entered our long trade at the previous uptrend’s swing high, we would have taken home a profit of nearly 157 pips. To manage our risk, we should place our stop loss below the correction’s swing low, just below the 38.2% fib retracement level. All in all, this pattern resulted in a successful long trade.
Conclusion
The measured move up is a bullish continuation pattern that spans a few weeks or months. Oftentimes, it manifests at the end of a prior downtrend, but it may also constitute a part of a larger bullish move. It consists of three parts: the initial uptrend, the correction, and the final rally. Traders take advantage of the final rally by setting a profit target as far away from the entry as the length of the initial uptrend. As with any other trade scenario, risk management is of utmost importance when trading this pattern. To that end, a suitable stop loss should be positioned below the correction’s swing low.

