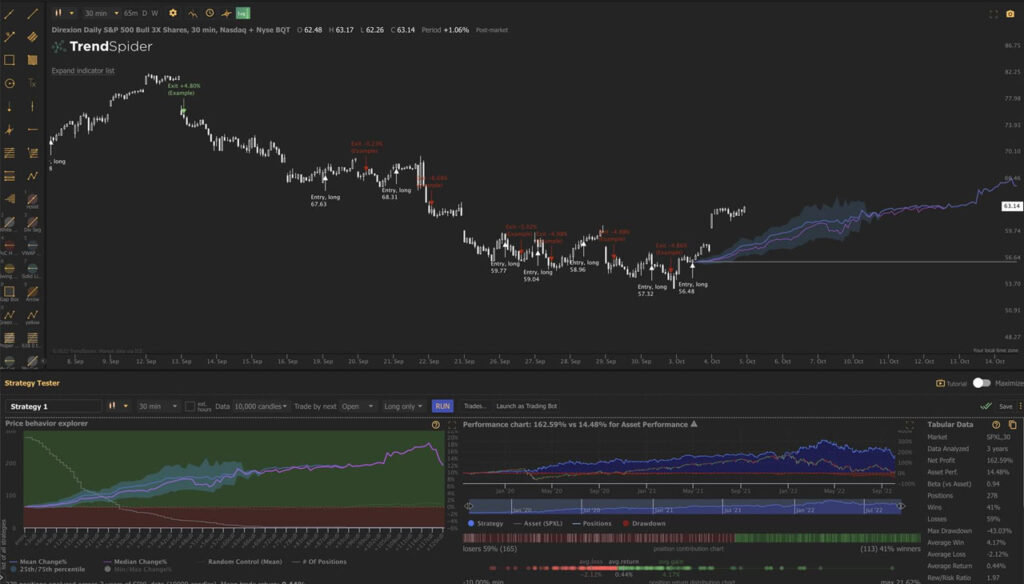
What is TrendSpider and why is it helpful for traders?
TrendSpider is a technical analysis platform that uses automated chart recognition and pattern detection algorithms to help traders quickly identify key support and resistance levels, trading signals, and trend reversals. The platform provides a range of features such as drawing tools, custom indicators, automatic alerts, automated strategies, backtesting capabilities, market scanners, money management tools, and more. It also offers access to real-time data from the most popular exchanges in the world including NASDAQ, NYSE, and CBOE.
One of the biggest advantages of using TrendSpider over other similar platforms is its ability to detect patterns on charts that may not be visible to human eyes. By analyzing large amounts of historical data points it can determine when a particular pattern or indicator may indicate a possible buy or sell signal. This helps traders make more informed decisions and potentially improve their trading results.
In addition, TrendSpider offers a wide range of customization options so that users can tailor the platform to their individual needs. It also provides access to live news feeds from major exchanges as well as market data from multiple sources including technical analysis, fundamental analysis, and quantitative analysis. Finally, it allows users to quickly view key performance metrics such as win rate, expectancy, profit factor, and more for any strategy they are testing on the platform.

Features of the TrendSpider trading tool include:
- Automated chart recognition and pattern detection algorithms: This powerful feature allows traders to quickly identify support and resistance levels, trading signals, and trend reversals.
- Drawing tools: The drawing tool provides a range of features such as trend lines, Fibonacci retracement lines, pitchforks, and more to help traders make better chart analysis decisions.
- Custom indicators: Users can create their custom technical indicators using the TrendSpider scripting language or use the pre-built ones available on the platform.
- Automated alerts: With this feature, users can set up automatic price alerts for any instrument they are trading so that they don’t miss out on any potential trading opportunities.
- Market scanners: This feature enables users to scan multiple markets in real-time to find trading opportunities.
- Backtesting capabilities: The backtesting feature allows traders to test their strategies over a range of data points so they can gauge how successful their strategy is before trading live.
- Money management tools: This offers users the ability to set up stop loss and take profit targets as well as manage their risk through position sizing and diversification.
Overall, TrendSpider is a great tool for traders who want to take advantage of automated chart recognition and pattern detection algorithms. With its wide range of features and customization options, it’s an invaluable tool that can help traders make better decisions and improve their trading results. The platform also offers access to real-time data from multiple sources which helps ensure traders have all the information they need to make informed decisions.
How to use the advanced charting features in TrendSpider?
The TrendSpider platform is a powerful tool for technical analysis and provides users with advanced charting features that can help them identify potential trading opportunities. To use the advanced charting features in TrendSpider, start by selecting your desired time frame from the options available on the left-hand side of the screen. You will then be able to choose which indicators or drawing tools you wish to display on the chart. For example, you could add trend lines, Fibonacci retracement lines, pitchforks, moving averages, and more. Once you have selected the indicators and drawing tools that you want to use, click “Analyze” at the top of the screen to see how they interact with one another.
Testing TrendSpider’s automated alerts
Another powerful feature of the TrendSpider platform is its automated alerts. These allow you to set price alerts so that you don’t miss out on any potential trading opportunities. To set up an alert, simply click “Alerts” at the top of the screen, select your desired asset, and then choose which type of alert you wish to receive (e.g. price breakouts, moving average crossovers, etc.). You can also specify how long you wish to hold onto the alert before it expires and when you would like to be notified if the alert triggers. To test how well TrendSpider’s automated alerts work, select a few different assets and set up several different types of alerts for each one. Then, monitor how often the alerts trigger and whether or not they provide you with profitable trading opportunities. If the alerts are providing you with good results then you can begin to rely on them to help you make more informed decisions when trading.

Cost and pricing options for TrendSpider users
The TrendSpider platform offers a range of pricing options depending on the features you wish to use. The most basic subscription is the “Starter Plan” which gives you access to all of the charting features, drawing tools, and automated alerts but does not include backtesting or market scanners. This plan is available for $19 per month or $199 per year. For those looking for more advanced features, there are two other plans: “Professional” and “Premium”. The Professional plan includes all of the Starter plan features as well as backtesting capabilities and multiple market scanners while the Premium plan adds money management and quantitative analysis tools to the list. Both plans cost $29/month or $279/year.
Advantages:
• Powerful chart recognition and pattern detection algorithms
• Wide range of features and customization options
• Access to real-time data from multiple sources
• Affordable subscription plans
Disadvantages:
• Lack of customer support & tutorials for new users
• Limited backtesting capabilities in the Starter plan
• Some features require additional fees for use
Summary
TrendSpider is a powerful tool for traders who want to take advantage of automated chart recognition and pattern detection algorithms. It offers a wide range of features such as drawing tools, custom indicators, automated alerts, market scanners, backtesting capabilities, and money management tools. The platform also provides access to real-time data from multiple sources which can help traders make better decisions when trading. There are three different subscription plans available ranging in price from $19/month to $29/month depending on the features you wish to use. With its advanced capabilities and customization options, TrendSpider is an invaluable tool that can help improve your trading results.
Review
- Real-time trade alerts and expert analysis: 10
- 24/7 customer support: 9
- Transparent track record: 10
- User-friendly interface: 10
- No refunds on subscriptions: 8


