TrendSpider automated technical analysis platform
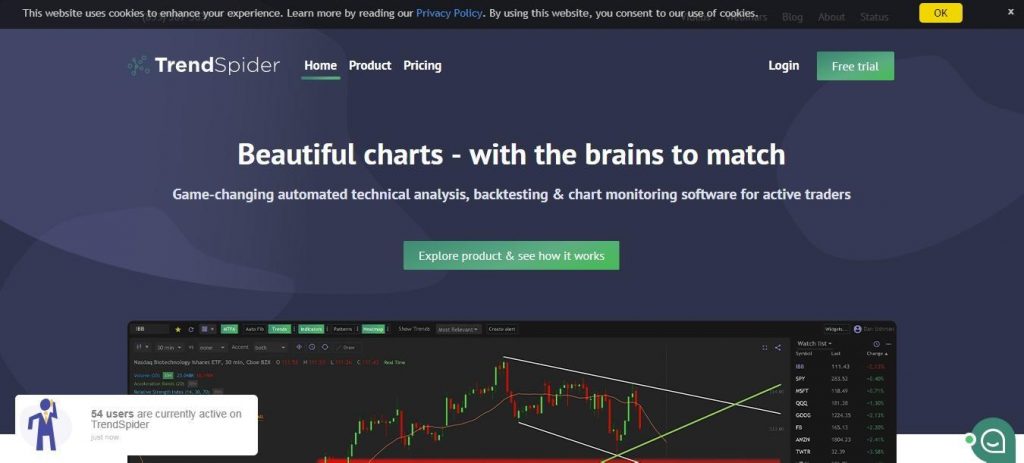
In modern realities, there are enough tools to automate trading. This means that a trader or an investor no longer needs to spend daily time manually drawing patterns, drawing charts, price ranges, and determining support and resistance levels by mathematical calculations. All this has been optimized. And one of the modern optimization tools is the TrendSpider platform.
It is a terminal via which you can monitor technical analysis, which is based on numerous algorithms. Traders facilitate daily work, like all patterns, support and resistance levels, lines and waves are built automatically. And the user receives a ready-made forecast on the price of the selected asset.
This company was created by a group of IT-specialists relatively recently, in 2017. The central headquarters is located in the city of Chicago, United States of America. The idea of the developers was that all possible technical analysis tools could be used automatically, based on pre-built algorithms and machine learning methods.
How much does it cost to use TrendSpider?
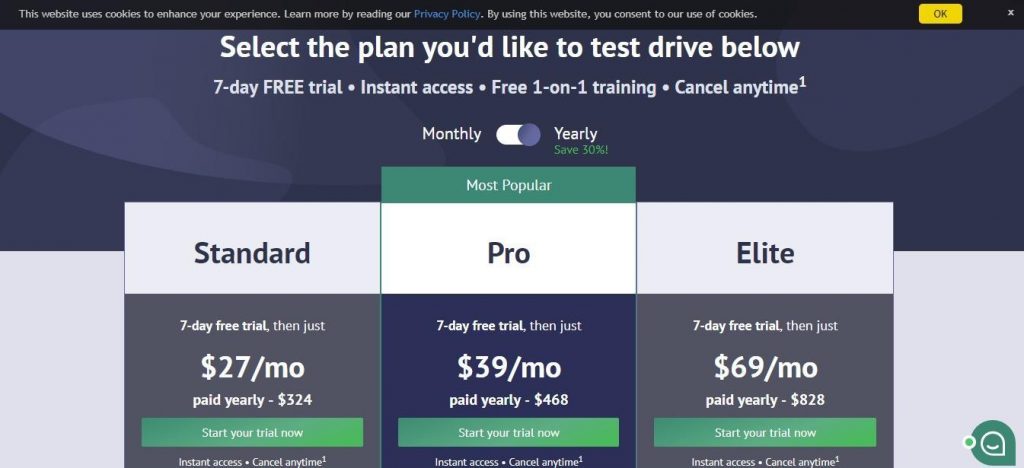
To test all the features of the system without restrictions, the company provides free access throughout the week. After the expiration of this period, you will need to pay the tariff:
- PRO Trader / cost $ 29.15 per month for 1 quarter or $ 24.75 if paid for in a year;
- ELITE Trader / cost $ 43.85 per month for 1 quarter or 37.25 when paying for the year;
- Analyst/cost $ 22.75 per month for 1 quarter or $ 17.65, when paying for a year.
The annual cost of using this service will cost from $ 200 US. But the company offers different variations and provides the opportunity to pay quarterly with a free test mode. This will reduce the initial costs.
How it all works in the TrendSpider platform

TrendSpider is made in the format of a web platform, similar to Metatrader. The user sees a graph in front of him, he can choose the necessary financial instrument. The design was created in such a way as to be less different from the usual elements. All the same candles, convenient menu with a selection of the right tool.
One of the main tools is the trend lines. They are built automatically on each selected graph. In this case, the user does not need to specify additional settings. An algorithm for rendering these lines will be interesting for many. They are based on highs, lows, fractals with cross rates.
Three basic analyzes are available to users:
- Original;
- Enhanced;
- Experimental.
In one form or another, different tools are used, so the result may differ. Developers are recommended to immediately test all possible functions in order to choose for themselves the optimal pool of settings.
Using all the tools, you can determine support and resistance levels, maximum and minimum points, oversold and overbought levels, trend reversal points, price range and much more.
Details on Fibonacci levels in TrendSpider
In the manual construction of Fibonacci levels, there is one major drawback – the difficulty of determining the minimum and maximum points of the price chart. But on the TrendSpider graph, the corresponding tool was formed in such a way as to most accurately determine these points. As a result, Elliott waves and wave patterns can be effectively built. On average, forecast accuracy is increased by 23-28%.
Indicators used in the analysis
The TrendSpider system includes indicators familiar to many traders: SAR, RSI, MACD, moving averages, and others. There are more than 40 tools available in this category. Deep settings for each parameter increase accuracy. But if you are a novice trader, you can safely apply standard indicators with basic parameters.
By analogy with X-ray, several layers of analytical indicators can be displayed on a graph in the system. This will allow monitoring the price of the asset from a single window.
Notifications
Trading signals according to the results of technical analysis can be configured to notify in the service itself or to e-mail. All this happens in a dynamic mode, without any delay.
Final Thoughts
TrendSpider was able to create a versatile and truly effective automated analysis tool. Of course, the service does not involve the automatic execution of transactions and it is not integrated into Metatrader. But a custom interface is a big advantage. Use the received signals and open trades directly on your account with any broker.
