
Triple bottom patterns are among the technical patterns that might signal a positive outlook for various types of assets. As strong volumes back this new direction in the market, it suggests that market players have an optimistic outlook.

Prices appear to be retaining their bearish weakness at three distinct, although closely spaced, points on the chart. These three price levels show that the market is growing more and more bullish, preventing any more price decreases.
The confirmation of these patterns by breaching resistance denotes a reversal when they are seen in low trading ranges prior to downtrends.
How does it work?
Among the most trustworthy patterns in market analysis, the Triple Bottom is often regarded as being one of the most reliable patterns. A new trend is formed after the three lows break past an established resistance level.
After a long period of bearish market dominance, the triple bottom often appears. If the second low is indicative of bullish momentum and an impending change in the market’s direction, it contrasts sharply with the first. It appears that strong support can be found near the third bottom. The bears’ negative run came to an end as they broke through barrier levels.
In a triple bottom, a large number of candlesticks produce three troughs or support levels that are equal or almost equal in size. When the third dip fails to retain support above the first and second troughs, the breakout pattern is considered to be complete.
These patterns represent a shift in the trend to bullishness following a previous downtrend. For technical traders, they are a constant source of inspiration when it comes to finding entry and exit positions. In this case, there are three equal bottoms, and, finally, a breakout over resistance to help us spot the positions.
Spotting the patterns
This design contains a significant number of candlesticks. Even if each candlestick tells a story on its own, when they’re all put together, they paint a complete image. A battle between buyers and sellers results in these patterns being formed.
The fundamental components of the pattern are three highs and three lows, which are similar to the inverted head and shoulders pattern. Triple bottoms, on the other hand, have all three of their highs almost exactly at the same level. The inverted head and shoulders design, on the other hand, has a lower low than the other two.
The triple bottom implies that the market is about to turn around and begin an uptrend, indicating that the market is in a downturn. This shows that the downward trend is losing momentum.
When a trend takes longer than expected to develop to its full potential, it is often thought that the price move following a breakdown would be more significant.
How to trade the pattern
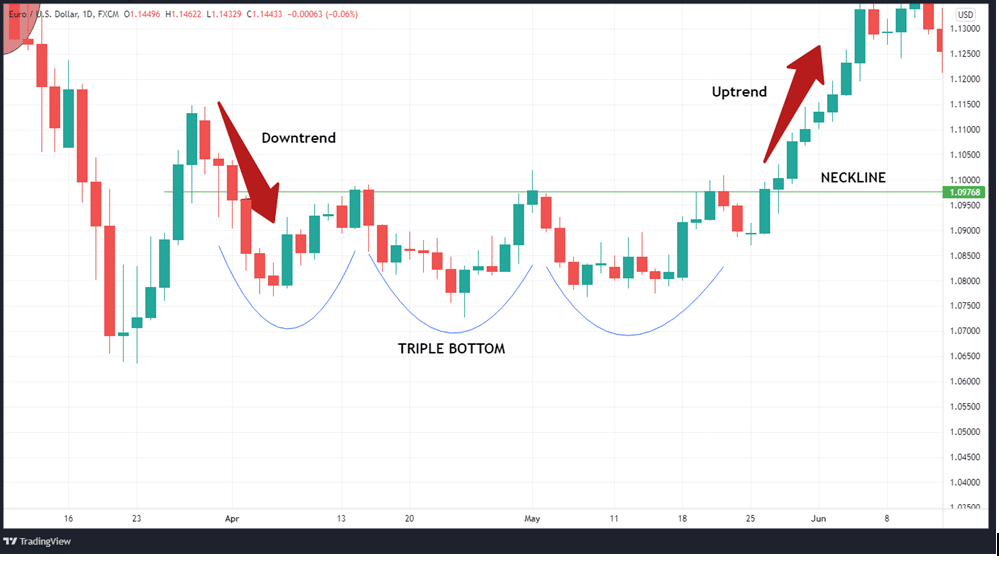
This pattern depends on a well-defined structure. Specifically, you will want to look for a downtrend preceding the three bottom. Traders should be on the lookout for three rounded bottoms, as well as the size of the bottoms, to see if they are forming.
If you had taken a long position, the neckline and the previous resistance level should serve as your key target areas—a breach of any of these two heralds a new trend.
You should also look at the interval/spacing between the bottoms. Ideally, the spacing should be equal. It is more affirming if the three bottoms settled at the same price. Nonetheless, in practice, all it takes is for the bottoms to line up more or less horizontally.
Due to the fact that it is a reverse pattern, the volume should decrease at every low. During the first bottom, the volume will be the highest, but it will progressively decrease, indicating that the bears are weakening.
This pattern is customary with most reversal patterns and is not completed until a breakout of resistance occurs. The market resistance is optimal at the highest point in this pattern.
Working example
In the EURUSD daily chart below, the price trend becomes bullish after the three bottoms that came after the previous downtrend (red arrow).
Place your stop-loss order at the lowest point of the pattern’s troughs.
Profit target
To get the profit target, we use the length between the neckline and the lowest point as your yardstick. Once you get the measurement, use it to project your price target. Breakouts in these patterns are usually followed by a gradual rise in price. It’s a good rule of thumb to measure the trading range in the triple bottom section of the chart to have an idea of how much of a price gain you may expect.
In summary
Although the triple bottom pattern is a trustworthy pattern, it is not recommended to take action until you receive additional confirmation signals. The changing volume of trade is among the most reliable signals of the reliability of the pattern.
Also, note that despite their usefulness, one should not rely solely on chart patterns for forecasting future price changes. The price of assets is affected by a variety of other factors, especially market fundamentals.

