
Trading and being able to generate consistent profits may depend on perfect timing. Anyone who can ascertain market conditions and identify market momentum is likely to have a successful career as a trader. Few indicators come close to Triple Exponential Moving Average (TRIX) in a field where one is sure to be spoilt of choice.

TRIX is a technical analysis indicator for assessing price momentum. It also does a great job of ascertaining overbought and oversold conditions. Unlike other analysis tools, it shows the rate of price changes while relying on the three-layered Exponential Smoothed Average.
It is also used as an oscillator ideal to identify topmost and lowest price levels. When used in momentum examination, it is able to filter out irrelevant price levels while focusing on the dominant trend. It does an excellent job in identifying oversold and overbought price levels, affirming its categorization as an oscillator.
How it works
When the technical analysis tool is used as an oscillator, one is essentially trying to identify the highest and lowest price levels. Consequently, whenever the indicators reading is positive, one should be wary of the underlying assets being overbought. In this case, one should prepare to exit in case of a long position or enter a short position as in most cases price would decline.
In addition, whenever the TRIX reading is negative, it signifies oversold conditions. Given that price has tanked significantly, short-sellers use this opportunity to exit the market as there is always a high likelihood of price correcting higher. Additionally, some technical analysis uses this gesture to eye long position in anticipation of price bouncing back.
Whenever it is used as a momentum tool, then any negative reading that appears would imply the momentum on the asset price is declining. Similarly, whenever the reading is positive, it hints that momentum is increasing and that price is likely to move with force in the prevailing direction.
Being a triple EMA, it places more emphasis on the current price data.
Zero line cross
Some market participants interpret a buy gesture whenever the signal line crosses the zero line from below, indicating that the price is likely to continue increasing. In case the impulse is increasing, the underlying price is likely to continue appreciating.
The chart below shows the NZDUSD price action. Once the signal line crossed the zero line from below, it affirmed NZDUSD had corrected and was destined to move higher.
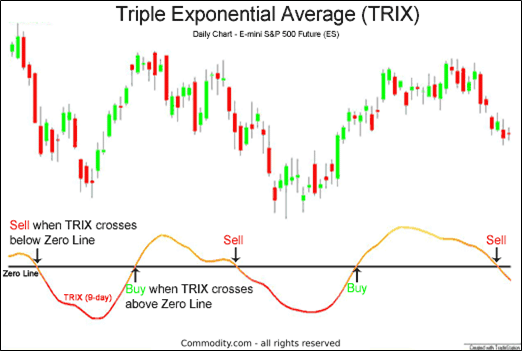
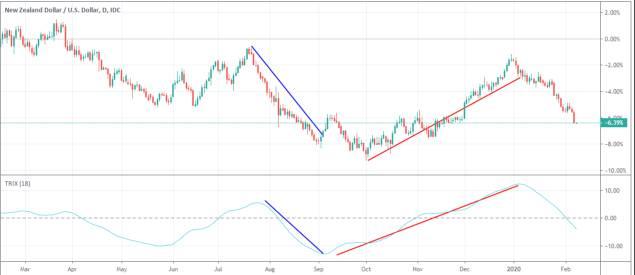
In return, whenever the TRIX crosses the zero line from above and moves below the zero line, it is interpreted as a sell signal, implying the price is likely to continue tanking. In the chart above, it is clear that as soon as the indicator crossed the zero line from above, the NZDUSD sell-off accelerated until oversold conditions were confirmed, resulting in a bounce back.
Using the signal line
Some technical analysts add a signal line to make the indicator more effective in generating buy and sell gestures. The signal line, in this case, will be a slow MA and will lag the TRIX line as it oscillates up and down.
Consequently, a buy signal will occur whenever it crosses the slow Moving Average from below and continues to move up. On the other hand, it would be time to sell whenever it crosses the signal line or the slow MA from above and move below the zero lines.
Identifying divergence
Divergence occurs whenever the price moves in the opposite direction of the indicator. In normal market conditions, both are supposed to move in the same direction. For instance, it will point upwards whenever the price is trending up, and when the price is falling, it will also move lower.
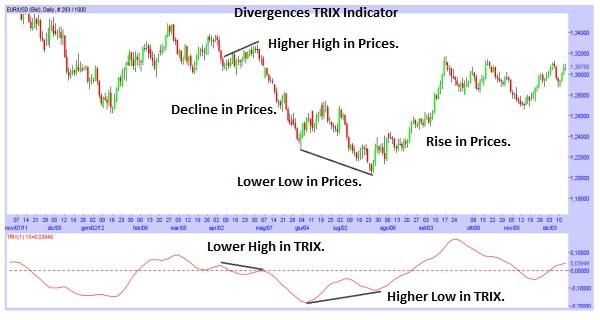
Whenever the price makes a higher high, it is often expected that the indicator will also move higher. However, in case the indicator moves lower and continues to make lower lows, the same should be a warning sign that the price is about to correct lower.
In addition, whenever price makes lower lows but the TRIX continues to trend up, making higher highs, the same is interpreted as divergence. In this case, the price is likely to bounce back and start edging up as well.
Crossover strategy
The technical analysis tool can also be used to identify the buy and sell points. In this case, one must ensure that one of the MA’s is fast-moving and the other is slow-moving. One can apply an 18-day EMA, which will be the slow-moving EMA, and a 9-day EMA the fast-moving.
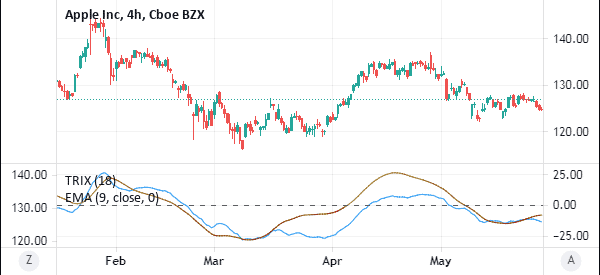
The buy signal will arise whenever the 9-day EMA crosses the 21-day EMA from below and starts accelerating up, as shown above. The sell gesture will occur when the 9-day EMA crosses the 21-day EMA above and starts edging lower.
Bottom line
TRIX is both a momentum indicator and an oscillator. The indicator hints at oversold conditions whenever it tanks below the zero neutral lines and moves lower, printing negative figures. It also motions overbought conditions whenever it crosses the zero line and trends higher, printing positive readings.
Additionally, buy hints are interpreted whenever the indicator crosses above the zero line, and sell pointers come into play whenever it is below the zero line. It can also be used to identify divergence whenever price and the indicator are moving in the opposite direction.

