The Rate of Change (ROC) compares the present price with a previous price from a predetermined number of periods ago. It is calculated by dividing the current price by the previous price and then given as a percentage. Its capabilities enable it to be used as a momentum indicator.
The ROC oscillates from negative to positive and vice versa, with point 0 acting as its axis. Rising momentum triggers a shift by the oscillator to above point-0 from the negative side. Following the same logic, when the momentum weakens, it moves from above 0-line or positive to below 0-line or negative side.
ROC indicator calculation explained
Let’s look at the formula of the indicator first.
ROC = [(Closing price today — Close prices n periods ago)/Closing prices n times ago] × 100
In most systems, the default ‘n’ is 14. However, many traders also choose 9 and 25. For long-term traders, an n period of 200 is preferable. A smaller period number may react more quickly to pricing, but it can result in fussy or erroneous signals. With a larger number, you should expect a slower reaction but with higher accuracy, thus a more reliable signal.
The basic working mechanism of this indicator can be summarized as follows:
- An upward rise in the rate of change indicates a fast increase in prices. A downward action shows a fall in prices.
- In general, prices continue to rise as long as the ROC remains in the positive territory. In contrast, prices decline if the rate of change is negative.
- The more the price appreciates, the deeper the ROC moves more into the positive zone. In the same manner, the more the price declines, the deeper the indicator moves into the negative territory.
ROC indicator application in trading strategy
The signals produced by the ROC indicator can be traded in several ways. Let’s look at them down below.
Crossings the zero line
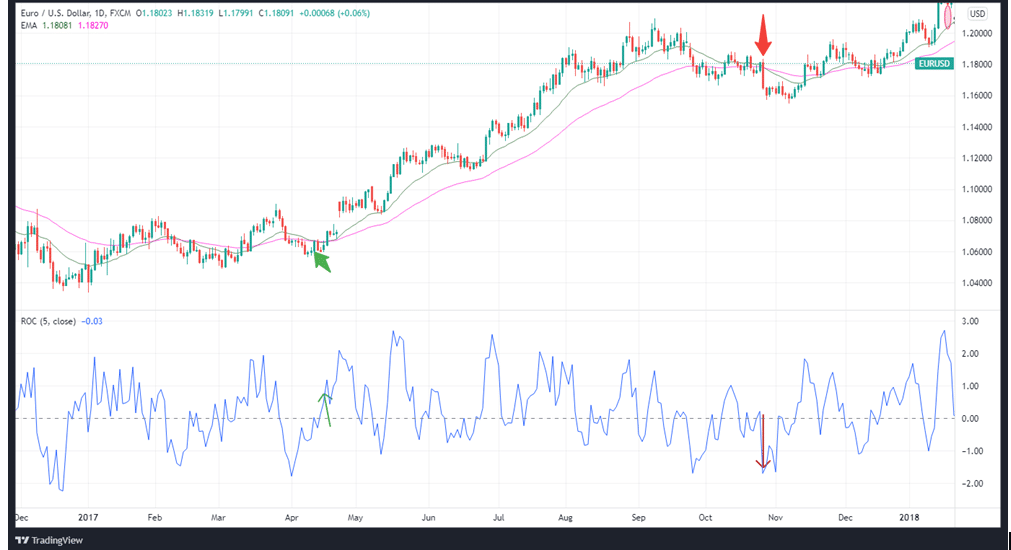
A zero-line crossing on the ROC chart indicates the emergence of a new trend. A down-up crossing of the zero line signals market bullishness. This usually has a corresponding uptrend. In contrast, an up-down crossing signals bearishness, which is signaled by a downtrend.
The ROC indicator is advancing over the zero-line in the first instance, as can be seen in the chart below. Buying is recommended at this time. Take note, however, that the Moving Averages remained negative throughout the period.

Take note, however, that the moving averages declined throughout the period.
ROC indicator breakout strategy
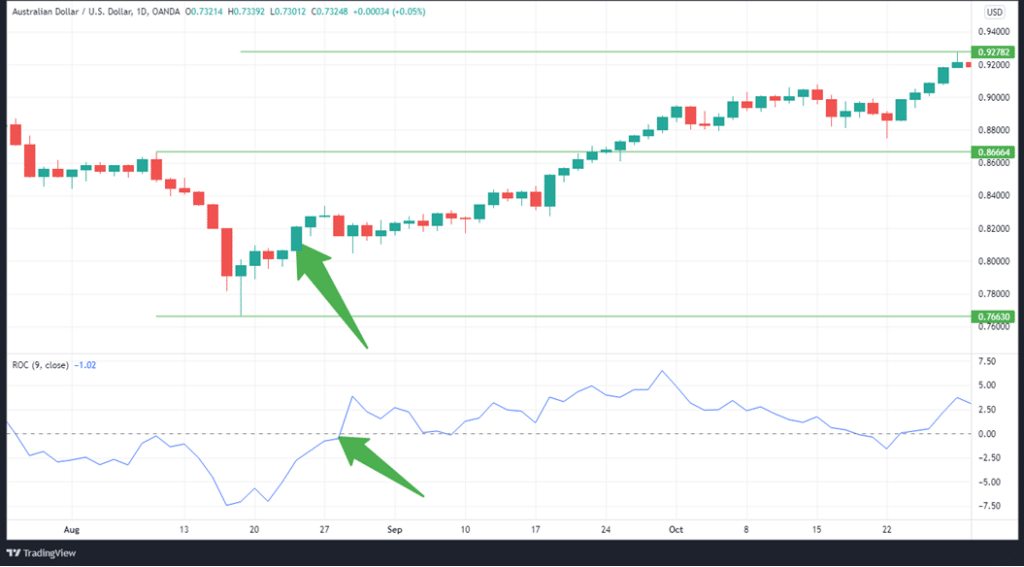
In the case of breakouts, there is no better signal to qualify breakouts than the rate of change indicator. When the price ranges or consolidates, ROC prints unchanging figures. A steady, strong increase or decrease will confirm that the breakout-initiated trend will continue.
When we look at the ROC set on a 9-minute time period, we can see that the price was stuck between the levels of 0.766 and 0.866 for the most part.

When prices were above 0.866, the ROC stayed above zero. The price also kept increasing, showing that the momentum continues.
Spotting divergences with ROC
If you notice that the price’s successive lows are progressively getting lower, while the ROC’s are getting higher, it signals a bullish divergence. It is a dependable signal that the momentum towards the downside is weakening, and a reversal towards the upside is likely.
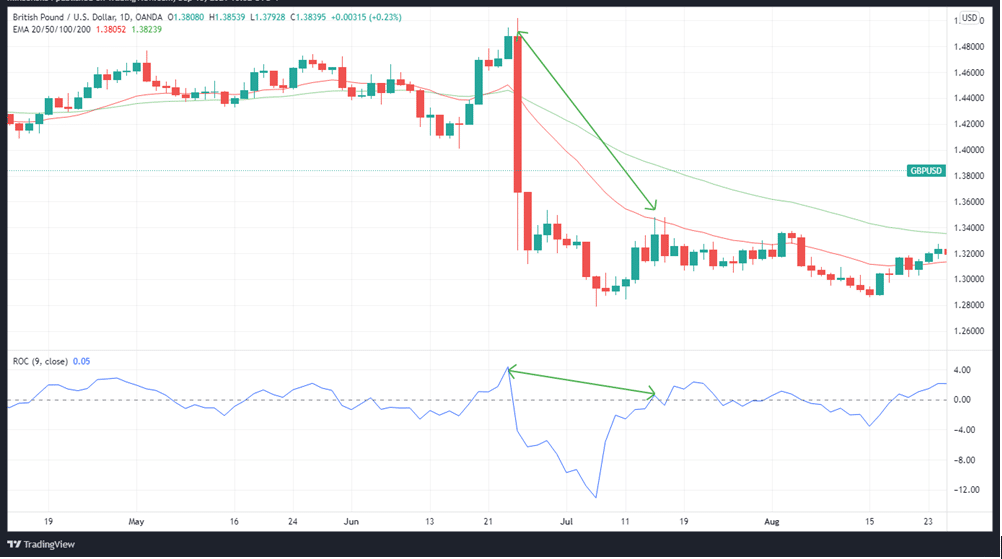
In the same manner, if the price’s successive highs are getting higher while the ROC’s successive highs are getting lower, it signals that a bearish divergence is imminent. This is because its behavior indicates that the upward momentum is weakening, although the price still attempts to hit new highs. With that in mind, you should then prepare for a possible downtrend.
The chart below shows a divergence, as the price posts higher highs while the ROC progressively registers lower highs.

There are at least two ways to trade based on a bearish divergence. First, you can go short once the bearish divergence is evident. Alternatively, you can wait for the downtrend to come into action and wait for the price to go low before “buying the dip.”
The ROC timing tool
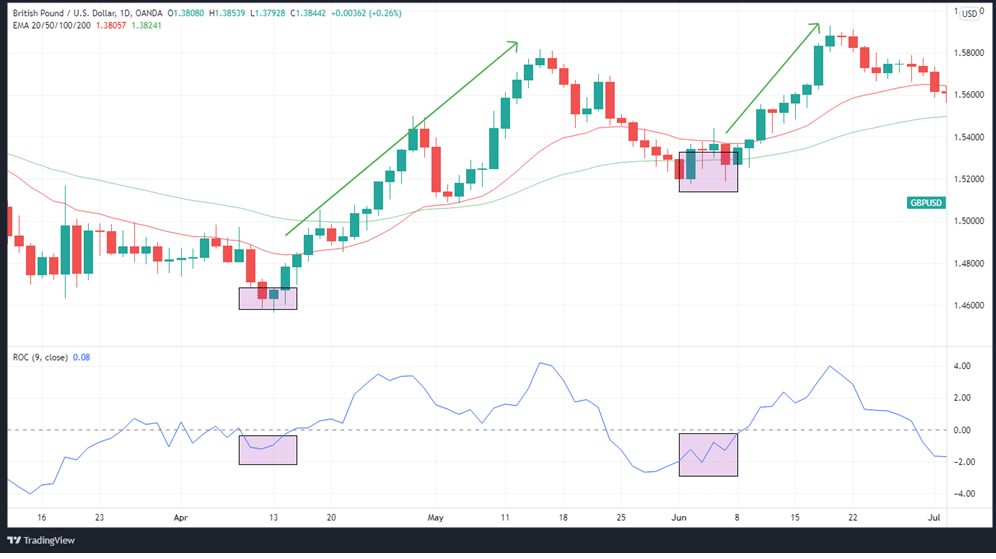
20-MA and 50-MA are used in the 1-day chart shown below. The ROC configuration utilized here is for nine periods.
The principle is straightforward. Take advantage of weakening momentum in an uptrend by buying when it is at its strongest or selling when the momentum begins to weaken.

In the area highlighted by the square, the prices are below MAs. Although the ROC indicator is below zero, it is showing signs of strengthening. This indicates a strong possibility that the price is going to increase.
Downsides of the ROC indicator
- It assigns equal relevance/weight to all price periods used, regardless of whether they are recent or old.
- Utilizing an overly long or short period when setting up the indicator can lead to conflicting integration of the signals given by other indicators on the chart.
In summary
The ROC indicator is a dependable tool for momentum-based trading. While it has its challenges in setting up the right periods, it can help achieve better results if integrated with other relevant indicators.


