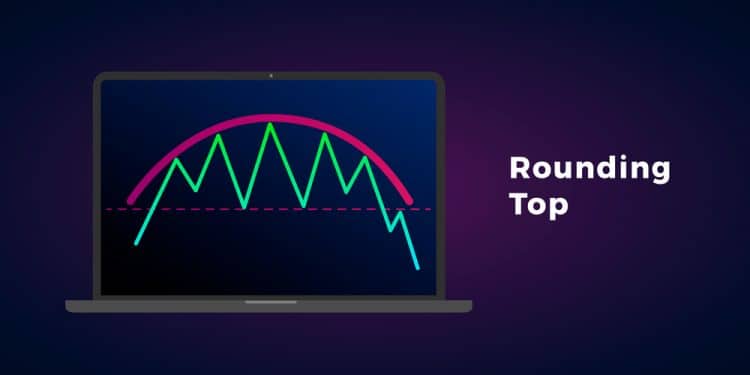
The rounding top pattern is an upward curve of a price movement in a trading chart that slopes downwards. It forms at the end of an extended uptrend while indicating a reversal of the price motion in the long-term. This formation works best when the breakouts happen close to the annual high. The rounding top also takes the shape of a dome or a rounding turn.

Like the rounding bottom, the rounding top forms an inverse (U-shaped) dome with the right rim higher than the left rim. It may take days, weeks, or months to form, depending on the trend change. The rounding top may give room for a downward or upward breakout. Prices may continue to move lower or higher after forming the pattern.
How the rounding top occurs
Before the rounding top occurs, prices are on a bullish turn, with the uptrend having a higher volume. Sellers are optimistic about a rise in prices, and most hold on to their shares. This occurrence forces the stock’s demand to rise. Prices rise along with the demand. However, the demand diminishes, and it is caught up with supply. Prices at the top hover at the trending value, and sellers start to increase.
Selling among investors will increase after the discovery of the stock’s lost upward momentum. This situation causes the prices to drop. Smart money traders will then take advantage of the declining prices and may buy the stock (go long). This situation may again push the stock’s price to new highs leading to an upward breakout. They may also decide to sell short, causing a downward breakout.
Identification
1. Found at the daily or weekly charts
Rising prices from the formation of the dome’s base bend and curve at the top of the trend line. They continue with the rounding turn until the dome shape begins a downward retracement. We may see an increase in buying demand that may cut short the retracement.
2. Equal prices at the start and end of the pattern
Prices of the stock or security at the beginning of the pattern are equal to prices at the end of the pattern. The average difference allowed between these two points can be a maximum of 3%.
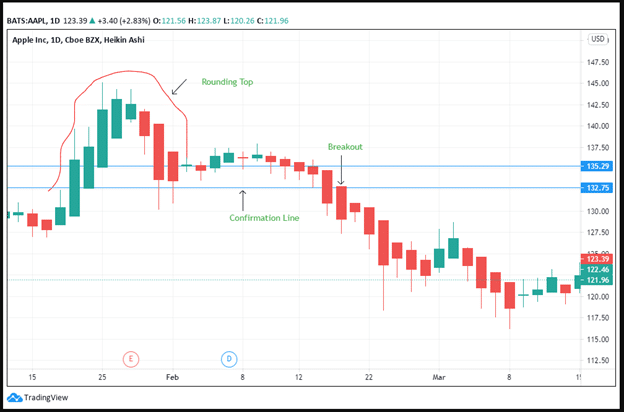
Figure 1: Apple Inc
In figure 1, we have identified that the saucer-shape of the Apple Inc. (AAPL) Stock begins at 132.75, and it ends at 135.29. The average difference between these two sides is 1.91%.
3. Rounded half-moon shape
There is a smooth climb in prices from the beginning of the curve to the end, in the form of a half-moon shape. The top of the dome appears to find resistance at $145.00 as of February 2021.
4. Curved volume
Volume is highest at the beginning of the curve as well as at the end. It is lowest at the center (As seen in figure 1). At the beginning of the pattern, the green bullish bars increase in size and length indicative of a higher volume. The middle green bar is the least in the pattern showing that the changing volume has ushered in a decline in prices. The red bars increase in size, showing a trend change as we head to the confirmation line.
5. Breakout
The price after the confirmation closes below the highest high in the rounding top pattern indicating a downward breakout. The highest high is close to $145.00, while the breakout happens at $135.29.
In some other charts, the close-in price above the highest high (say above $145.00) may signal an upward breakout. This situation may indicate that prices will have a bullish continuation rather than the bearish reversal that we expect with the Apple Inc. stock. We can also say that the stock has hit resistance at $135.29 and is now trending downward.
Trading strategies
1. Compute the target price
Get the target price by subtracting the lowest position of the right rim of the pattern from the highest position of the rounding top. In our case, we will subtract 145.00 with 132.75. The difference is 12.25. Since we have established that this pattern brings forth a downward breakout, we will subtract it from $132.75, the lowest position of the right rim. Our target price becomes $120.5.
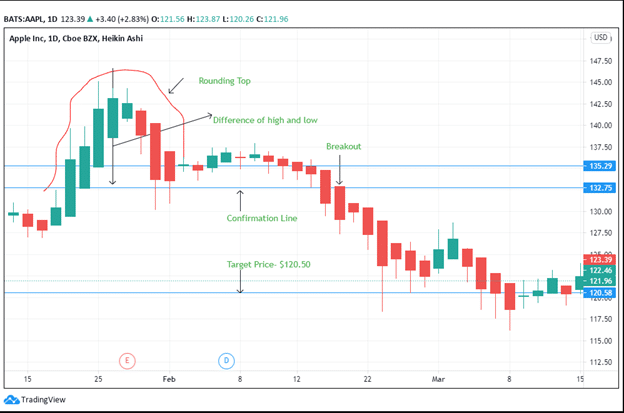
Figure 2: Target Price of Apple Inc Stock
2. Buy or short at the breakout
Buy or short the Apple Stock at the breakout position. Keep in mind that if the breakout is upward, you will buy the stock or go long. But if the breakout is downward, then you will short the stock. In our case, we will short the stock since it has a downward breakout. Look at the lowest position of the right rim to locate the confirmation line.
3. Stop loss
Place the stop loss about 10-20 pips after the stock hits the target price. You can choose to buy the stock after closing the target price. In most cases, prices will begin to bounce back after the target price is reached. You can expect the stock to reach a 5% retracement depending on the fundamental strength of the trade.
4. Support or resistance
In the case of the Apple Inc. stock, the right rim of the rounding top pattern shows that the stock has hit support at this level. Further, the stock trading below this level shows that it has hit resistance close to $132.75.
Conclusion
The rounding top pattern is a curved shape that begins from left to right. The volume of the curve increases from the left and decreases at the top. It increases to the right as prices decrease to the left. The curve is formed by an increase in selling action among investors. The inclusion of smart money traders may increase the stock’s price by buying into the stock. A downward breakout is formed if prices on the right close below the rounding top high. Investors should sell on the downward breakout and buy the stock in an upward breakout. It is important to compute the target price using the rounding top and trade in the region obtained.

