
In the world of forex, the trader who is able to hold on to her or his conviction on the market’s direction is the most successful. The reason why it is difficult to succeed in trading is that the markets trick and test you all the time.

The price will move in your favor, then against, then again in favor, and so on, till many traders lose conviction and exit their positions. Only those who stick to their guns manage to make great profits.
This especially applies to traders who based their strategies on technical analysis. Some of the most profitable trades made using technical analysis are the breakout or breakdown trades.
FX pairs often get trapped in channels as the price remains in a particular range for a long period of time. The channel is defined by the upper and lower bounds known as resistance and support level, respectively.
As soon as the price increases enough to get close to the resistance level, it starts falling, as seen below. Similarly, when the price is falling and approaching the support level, it bounces back. This way, the price is trapped in a channel.
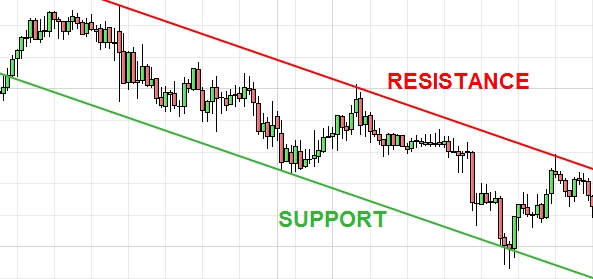
What this means is that there is a significant amount of position build-up on both the long side and the short side. So if the price does manage to breach either resistance or support level successfully, the move is huge. This move is called a breakout move as the price “breaks out” of the range, as seen below.
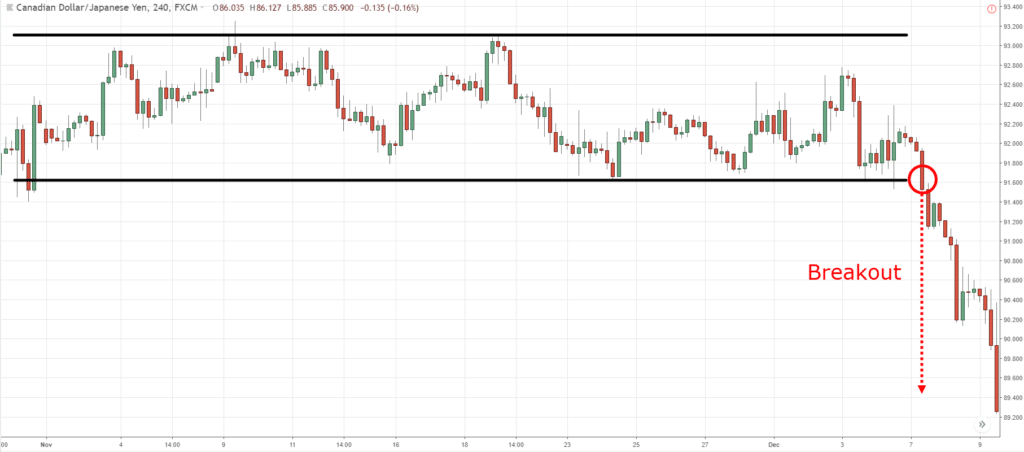
Usually, when the breakout happens, the move is very strong, and traders make huge profits on this. However, it is not clean at times, and the price starts reverting back after the initial breakout.
This is when many traders panic and exit their positions early. They think that the setup they are trading in might be wrong, that they have misjudged the resistance and support levels, and therefore, the breakout isn’t materializing as expected. However, that isn’t necessarily true, and it might be the case of a throwback or pullback.
Throwbacks and pullbacks in the aftermath of a breakout
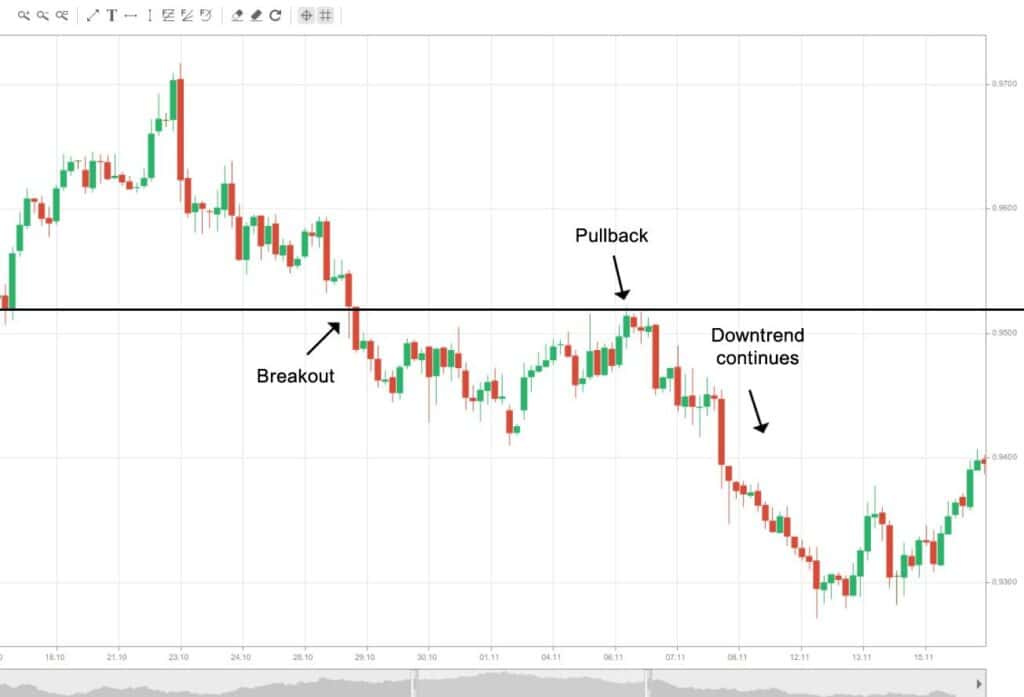
So what exactly are throwbacks and pullbacks? Let’s analyze pullbacks first. As seen below, let’s say the price has broken below the support level and is heading lower. However, suddenly the price turns around and starts heading up. This is the classic case of pullback.
Now there are two scenarios in such a case. First is where the earlier support level, which was breached, becomes the new resistance level for the price. So the price heads up to that level and then falls back.
More often than not, this is the case, and we will explain to you why. When the price has been trading in a channel, traders expect the price to bounce back from the support. As soon as the price is near the support level, they go long.
However, when the price keeps going lower, and there’s a breakout, these traders start accumulating losses that are not sustainable. Hence when the price starts returning to the initial level, these traders close their long positions which are effectively selling and that again pushes the price back down.
The second is where the price keeps rising and goes past the initial support level. That means if you entered at the breach of support, your position would be at a loss.
This second scenario is called ‘false breakout’ as the price initially broke out of the channel but then returned back to it. This typically happens when there’s some news flow on the fundamental level that has changed the direction of the price.
Throwback is the exact opposite of pullback, where the price initially breaches the resistance level of a channel and then starts falling back to the initial resistance. The same two situations might arise now, albeit in the opposite direction.
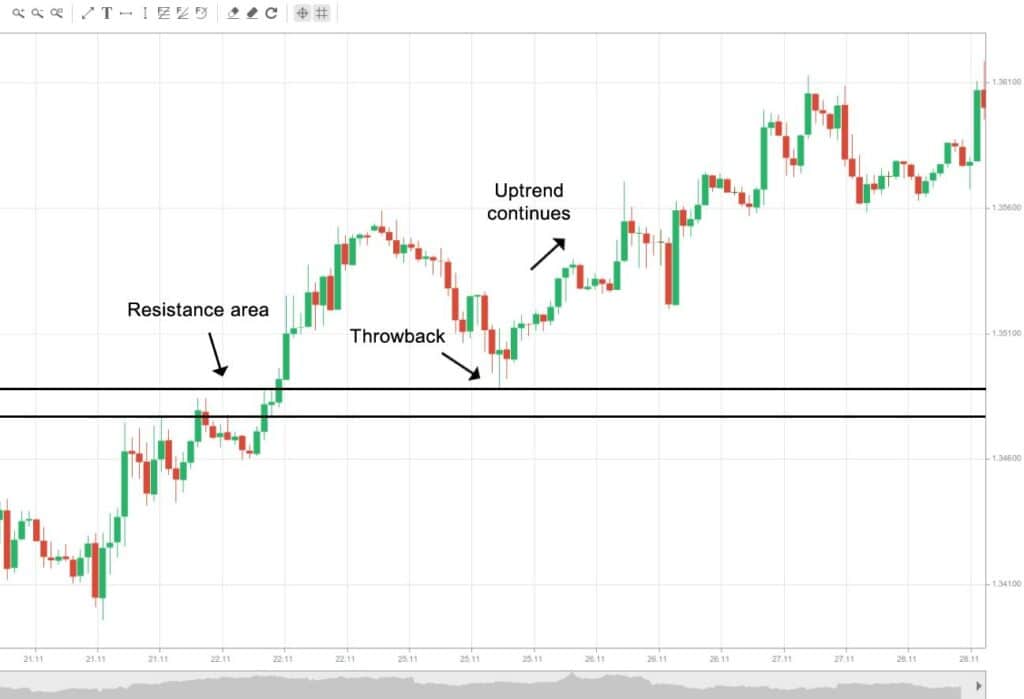
The price now might fall and breach right past the initial resistance level or the price can reach the initial resistance level, which now will become the new support level and bounce back from there.
How apply the concept in trading?
Let’s find out what we as traders need to do in the case of a throwback or pullback. The first and foremost rule is not to panic. Breakouts are some of the most profitable trades, and the biggest mistake many newbie traders make is to exit their positions at the sign of first reversion.
This is often because of the trailing stop-loss, which might trigger in case of a throwback or pullback. So the critical threshold to watch for is what the price does when it’s near the initial entry-level, which would have been the support or resistance, depending on the type of breakout.
It’s generally observed that the price resumes its trajectory once near this critical level as the traders who weren’t expecting breakout will cover their positions at this level, thus triggering a reversal.
So traders must hold on to their positions in the case of a throwback or pullback instead of panic closing at the first sign of reversion. But, unfortunately, what often happens is the price very well continues in the direction of breakout and yields massive profits to the trader.
However, as we know, markets are always uncertain, and you might be unlucky enough to face the case of a ‘false breakout.’ Therefore, in case the price continues to move beyond the discussed threshold, traders should respect their stop loss and exit their positions according to it.
The risk-reward ratio of these trades is quite favorable as you would only lose as much as your stop loss, but the returns could be unlimited as post-breakout the price move on average is quite significant.
The trap here is exiting your positions early because of a throwback or pullback. Traders who don’t know this concept exit early and miss out on huge profits, while those who understand it well will hold on to their positions and make a killing.
Read also: 5 Best Swing Trading Indicators For Beginners

