Volume spread analysis (VSA) is a technique in which traders use the volume of trade per candle to assess the direction of the market. VSA is, therefore, a method of predicting market direction by examining the volume-price relationship. It examines the volume per candle, the spread between the open and close prices, and the range.
On a forex chart, VSA analyses the interaction between three variables to estimate the balance between supply and demand and the expected short-term market direction.
Key elements of VSA
VSA examines the following aspects: Accumulation, Mark up, Distribution and Mark down.
Accumulation
As long as there is a surplus of anything, there will be no demand for it. There will be a rise in demand as the supply shrinks and more people want it. In the accumulation phase of VSA, insiders stockpile tradable assets, growing their stake in the business. The value of assets will appreciate as long as insiders continue to purchase them.
Congestion zones are the most common places for accumulation to build up. Most of the time, the asset’s movement in a congestion area is sideways, with no apparent desire to move up or down. Therefore, the price drops while the volume increases throughout the accumulation period.
You should keep an eye out for the following things:
- The first thing to ensure is that the volume noise is low. There shouldn’t be any massive spikes in volume. It doesn’t matter how much more volume there is, as long as the spread between the up and down days’ volumes is modest.
- It’s also important that the spread between high and low bars is small.
- Volume should decrease near the support level while rising near the resistance line.
- The asset should have been moving in a narrow range for a few weeks or even months before it can be considered for a long-term investment.
Mark up
When the accumulation area’s top breaks, the Mark up phase begins. Candles with higher lows and a higher closing signify an increase in the market. Because no one is putting up a fight, there is a notable small volume of trade. This comes with a modest amount of short corrections. It would be bad news for buyers if the volume of trading was large, as this would indicate that more sellers are entering the market.
A short correction is used to close out positions that have made a profit. Short corrections must always have a higher low point than the previous correction. When the up candles get progressively smaller with the traded volume being low, it is a strong signal that the Mark up phase is coming to an end. This then sets up the stage for weak money to enter the market.
Distribution
After buyer activity peaks, seasoned traders begin to unload their holdings without reducing their prices, as weak money enters the market and puts downward pressure on prices. It’s rare to come across a well-defined distribution in which the smart money sells its stakes to the weak money.
Mark down
After skilled traders exit their positions, Mark down is the next step. This is an eventful stage of the market cycle, during which investors tend to panic. Short, wide candles are the norm for this phase. The loop repeats itself all over.
VSA in markets that are rising
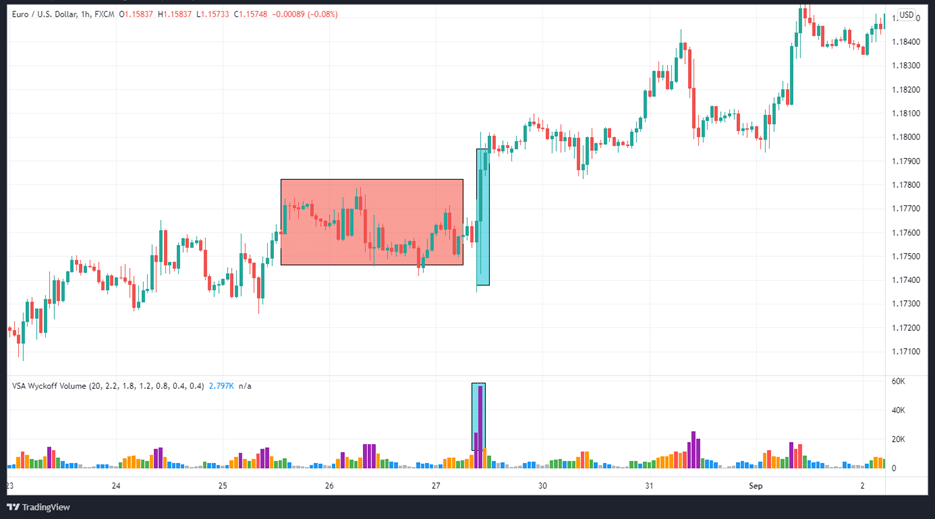
There is bullishness in VSA when professional traders, who have a bullish perspective of the market at the time, cause an abrupt rise in the market’s price. Using the chart below as an example, the highlighted area in red denotes the location of trades that have been locked in. Then we have the area in blue that represents bullish expert traders’ gap-up.

Furthermore, the volume has risen significantly, supporting the change. In other words, if volume supports the advance and market makers are confident, we can rule out an upward trap move.
For the vast majority of traders, wide spreads are meant to prevent them from participating in the market.
Because it’s uncommon to buy an asset today when you might have gotten it for less yesterday, this will discourage people from buying. At this point, short-sellers who were motivated to do so by the timely revelation of bad news are also concerned. As a result, we can conclude that the volume uptick is reliable as a bullish indicator.
VSA in bear markets
The signals are opposite for a bearish move. When the volume of down-bars is high, a bearish trend is in action with a strong momentum. It is possible that the price decline is not natural, and that the demand will outstrip the supply, as indicated by the large volume of transactions.
A decrease in volume on bearish bars indicates that professional traders aren’t interested in seeing the price fall any lower. Even if the market continues to fall for a while longer, the price may eventually rise because of a lack of supply.

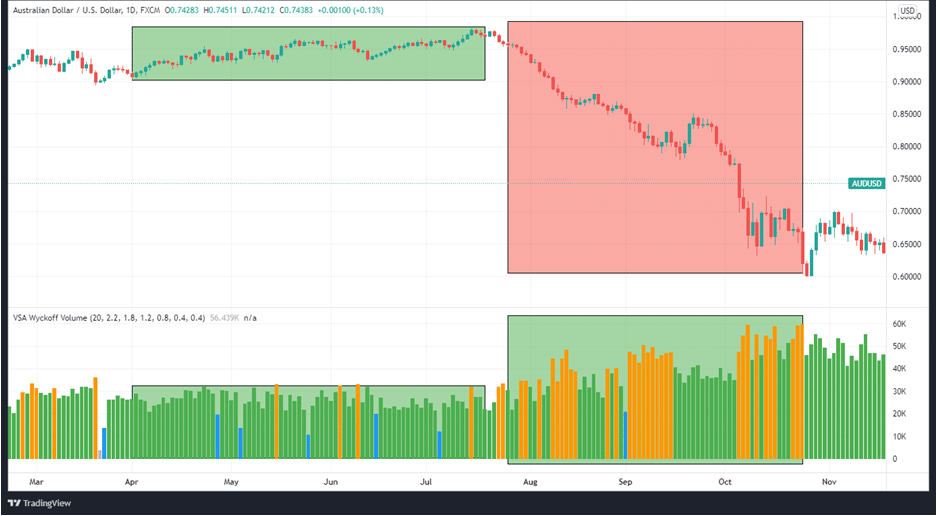
Traders who are locked in can be seen in the chart’s green area (sideways trend). After that, there is a sharp drop in price and an increase in sales, as indicated by the area highlighted in red.
Moreover, the volume is significant throughout the green, red zone, indicating big traders’ interest in the downtrend.
In summary
Because it provides an additional market dimension for study, volume is an important factor in the trading analysis. Most traders play into the greed and panic that comes with fluctuating market volume. Therefore, the volume also becomes important when determining the trend that the market is likely to follow.


