
Did you know volume is one of the most important indicators in trading? Yes, but why, and how can we use it in our favor? Well, it reveals what institutional traders are doing and allows us to know if they are buying or selling.

What is volume, and what can it tell us?
Is the number of units, contract, or money that is negotiated in a determined period of time. It is normally reflected in the lower part of the chart by means of a vertical bar that corresponds to a certain moment of quotation.
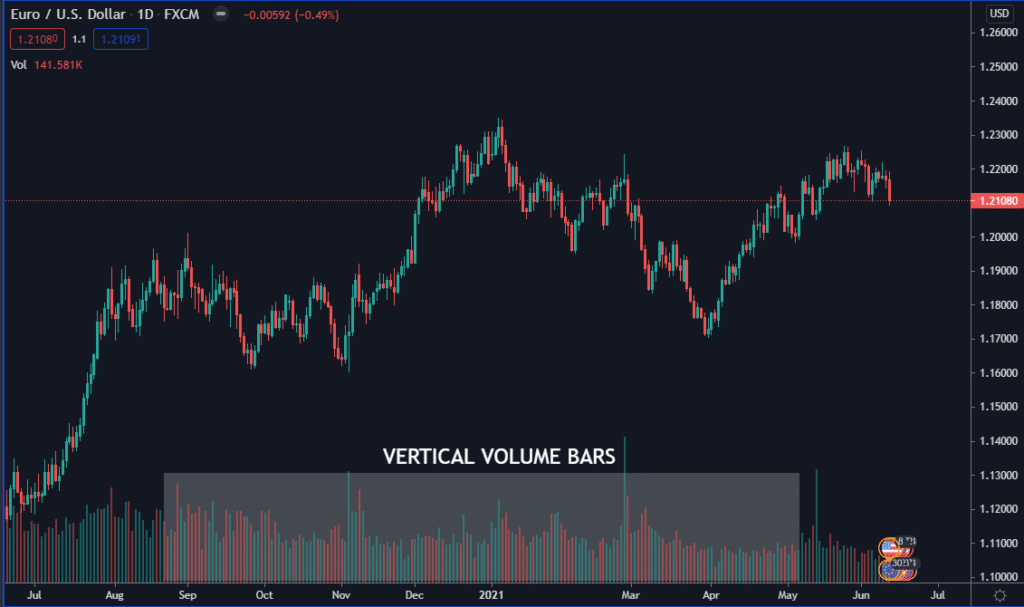
If we are looking at a daily chart, the bar will correspond to what was traded on that particular day. If the chart is one minute, it will reflect what happened in that minute of trading.
Stocks vs forex: differences in data
There is no central authority that controls the Forex market. There is no single entity in charge of enforcing each operation. If you trade stocks, all transactions are carried out through a centralized market such as the NYSE or NASDAQ. For example, we have Apple in the chart below. On April 9, the volume was 106.687 million shares.
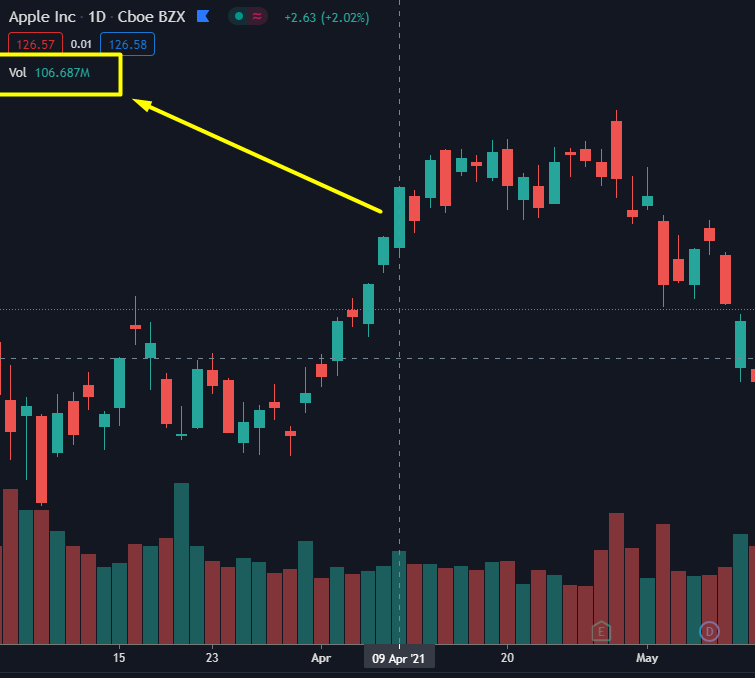
This can be a key piece of information, but also, we should know something else – the number of total shares.
It is useful to know the total number that is traded, which is called floating. When we look at Yahoo Finance, we find that the float for Apple is 16.67 billion. So in this example, 106 million do not represent a lot of the volume, relative to the 16.67 billion available for trading.
Let’s move onto the forex market to see if these same principles apply.
How does volume work in forex?
After reading the theory above, you could be ready to incorporate a volume indicator into the charts. However, before doing this, it is crucial to understand that this works differently in currencies.
There is no way to calculate precisely how much “float” – the total amount of a given currency is bought and sold each day.
Since there is no primary market in which all transactions are executed, there is no way to calculate it. So the data that we see on forex price charts is actually different among brokers.
For example, here, we have two screenshots of the EUR/USD currency pair taken simultaneously. The left chart from Oanda and the right from FXCM. It is the same date, but each broker shows different information.
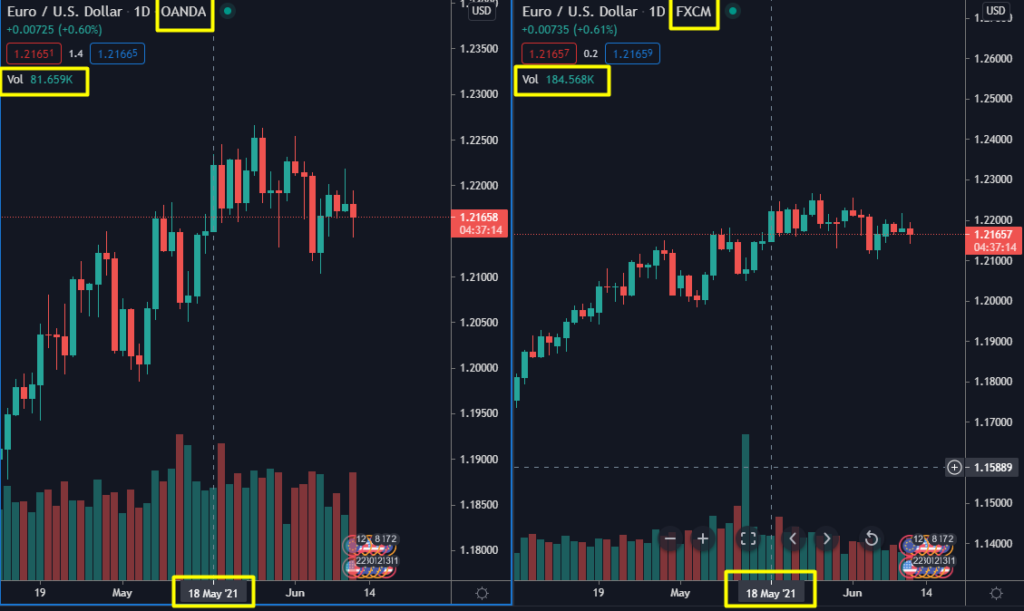
I have to say that this difference in data is not too relevant. I just give you this information for educational purposes, mostly.
Finally, I want to share two very important rules that I apply to my strategy:
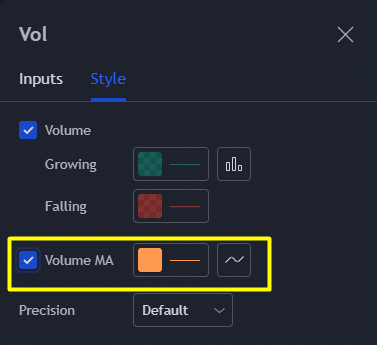
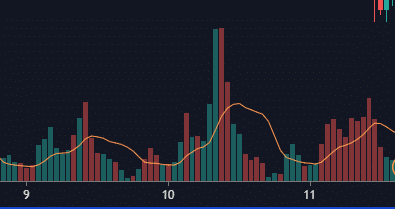
1. The volume always has to be measured in relation to the previous bars. To know if it increases, decreases, or remains stable, I use the Moving Average applied to the volume indicator.
2. It is important to pay attention to where it occurs: resistance, support, or in the middle of a trend.
Knowing the rules, let’s find some practical examples.
As we see in this chart, the price after remaining trading in a range ends up breaking the resistance zone.
Can you see how the volume has behaved? It has grown significantly, showing that this area was really relevant. This gives us good information to consider opening a trade because institutional traders are involved.
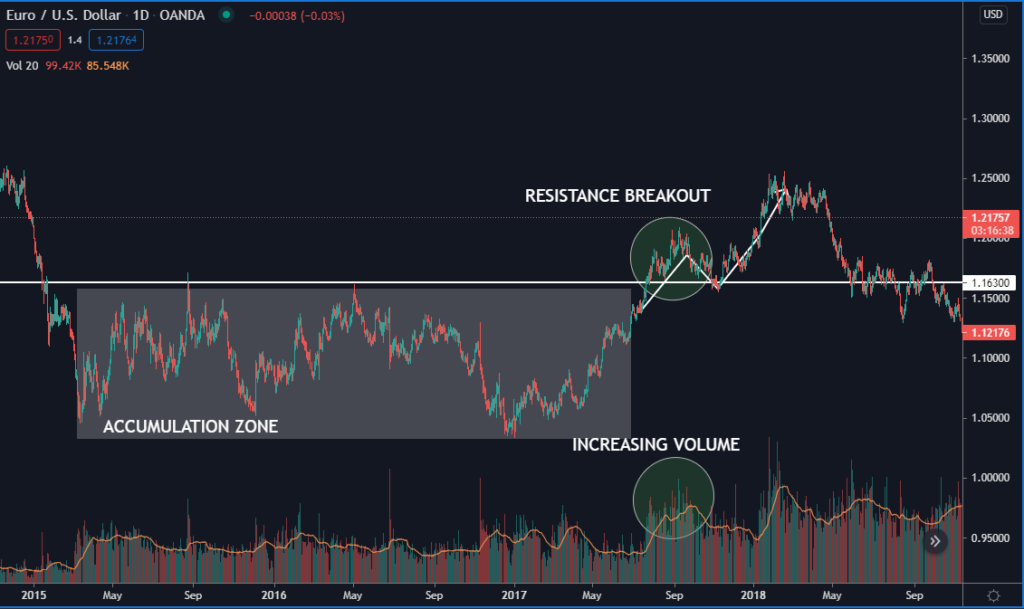
What if the price breaks a level, apparently important but not accompanied by a growth in volume? We should be wary because this could be a false breakout.
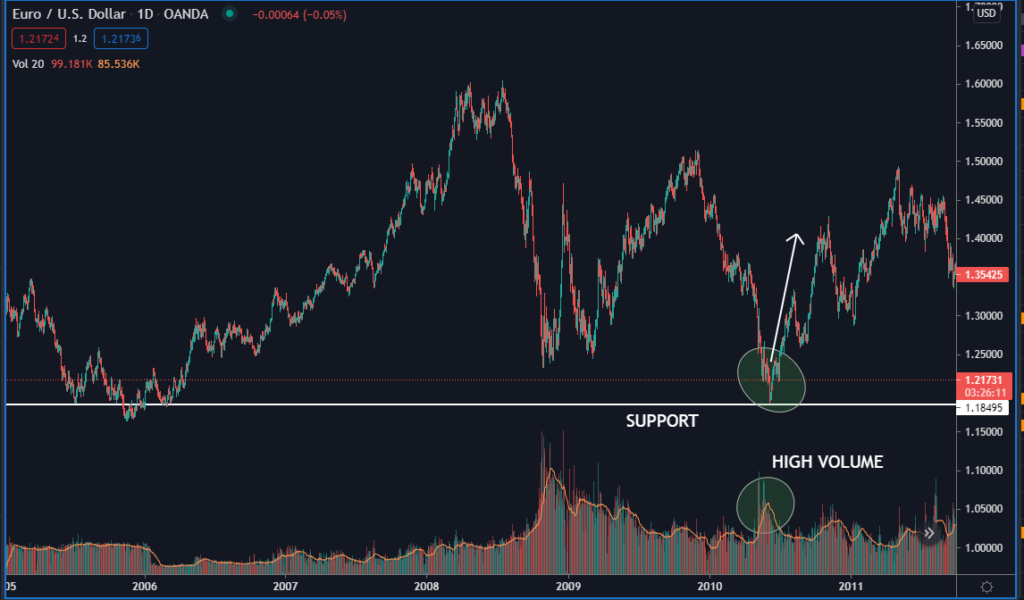
In the second example, after falling, the price touched a previous support zone and then rose. This means that sellers could not continue pushing the price down, and buyers were defending territory. If you can go long in this zone, you may catch the beginning of a trend.
Be careful with volume divergences
If the price rises, the volume must follow, showing us a healthy trend. If, on the contrary, we start to see a divergence, that is, price moving in one direction but volume is decreasing at the same time, pay attention – it is a warning that the trend could be ending.
One of the indicators that help you find these divergences is the cumulative volume delta. It’s calculated as total market buy orders minus market sell orders. If the indicator is moving up, then we have more aggressive buyers, and if it is moving down, we have more sellers.
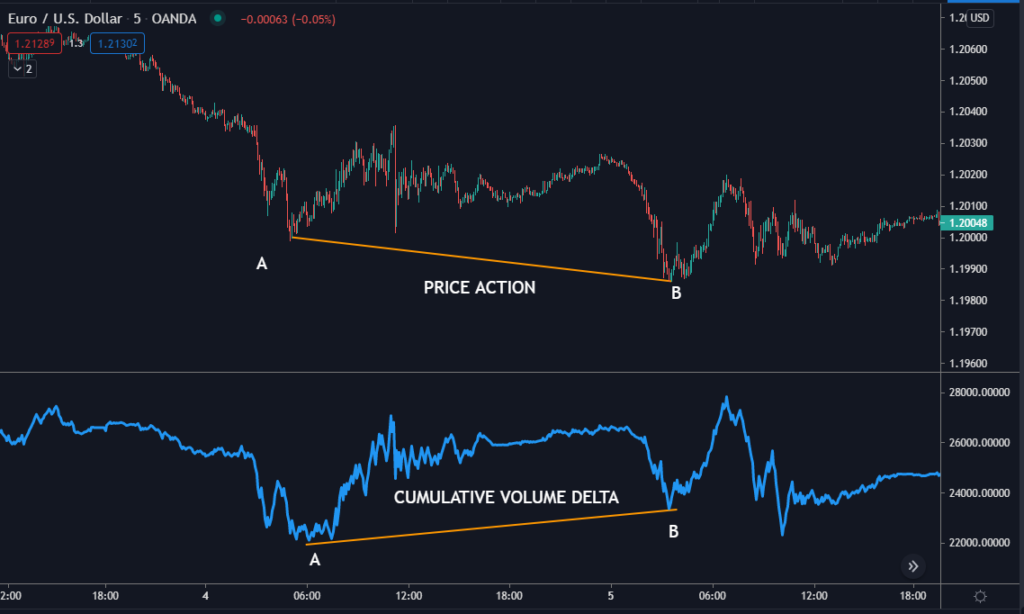
In the above screenshot, we can see that the delta was not moving with the price from point A to B. In this case, Delta helped us to see the lack of seller participation. For this reason, point B is a good entry zone.
Conclusion
When you are analyzing, always ask this question: what is the price doing with that volume? In an upward trend, the logical thing is to see an increase in volume, especially at the beginning. On the other hand, the volume may decrease as we reach resistance.
Pay attention to divergences in a bullish or bearish cycle. This can give you a clear signal of the end of a trend.
We must understand that when an exaggerated volume appears, one that had not appeared before, it is due to the participation of institutional operators. So, we are interested in detecting abrupt increases in volume.
Remember, If we compare the present with the previous volume in important zones, it will be easy to make better decisions in trading.
Read also: On Balance Volume Indicator – Top 5 Charts You’ve Missed

