A profit goal is a set price at which an investor will terminate a trade with a positive return at the close of the market.
The point at which one wants to exit a trade can be laid down using one of several approaches or criteria, and it can be attained using a variety of strategies or tactics.
A profit objective is the amount of cash you hope to create from a deal. It is a crucial aspect of order management since it assists one to stay on track with their trading objectives.
If configured as a pending order, it executes transactions automatically. This happens, regardless of whether one is paying attention to his trading screen or not.
Reasons for profit targets
A profit target technique might assist a trader in cashing in on gains at the same time as avoiding the possibility of losing when the market reverses direction.
Profit objectives may be viewed as an integral component of trade management, which is critical in risk management. The market does not always move in one direction; it might reverse at any time.
A profit goal guarantees that you do not maintain a position for too long, only to have your running profit wiped away before closing your trade.
A profit goal helps you to obtain adequate advantages for your risk while preventing a winning transaction from turning into a loss.
Because markets fluctuate rather than move in a straight line, any profit can be lost just as soon as it is earned. Profit objectives are used by experienced traders to keep track of their performance.
The ATR
The ATR (Average True Range) is a volatility indicator that weighs the price oscillation scope over a particular time frame.
Many investors use the 20-period ATR to check the market volatility and to predict where to place their stop loss most accurately. For example, if you trade on the daily time frame, you can place your stop loss X times daily ATR away from the current market price.
The structure of the market
Several investors utilize the market structure to determine the most appropriate place for their profit goal.
Even though there might be several methods for them to accomplish this, you may consider the ones below.
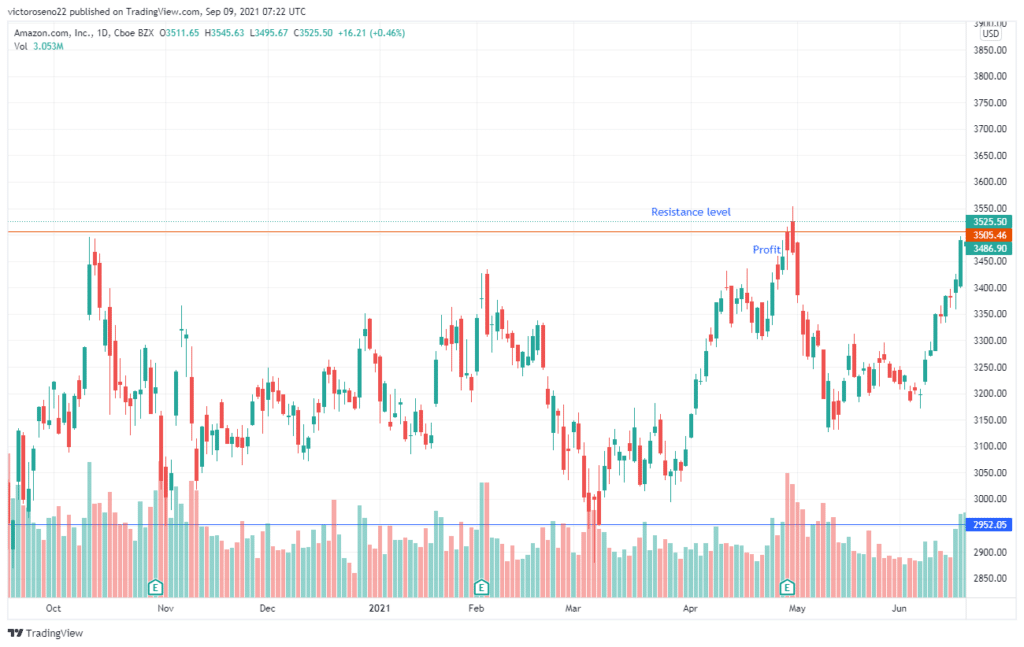
Support/resistance levels
Support or resistance level assists investors in estimating where they should place their protective stop orders and profit target.

This allows them to project at what prices the market is likely to reverse and close the position without giving up profits too much.
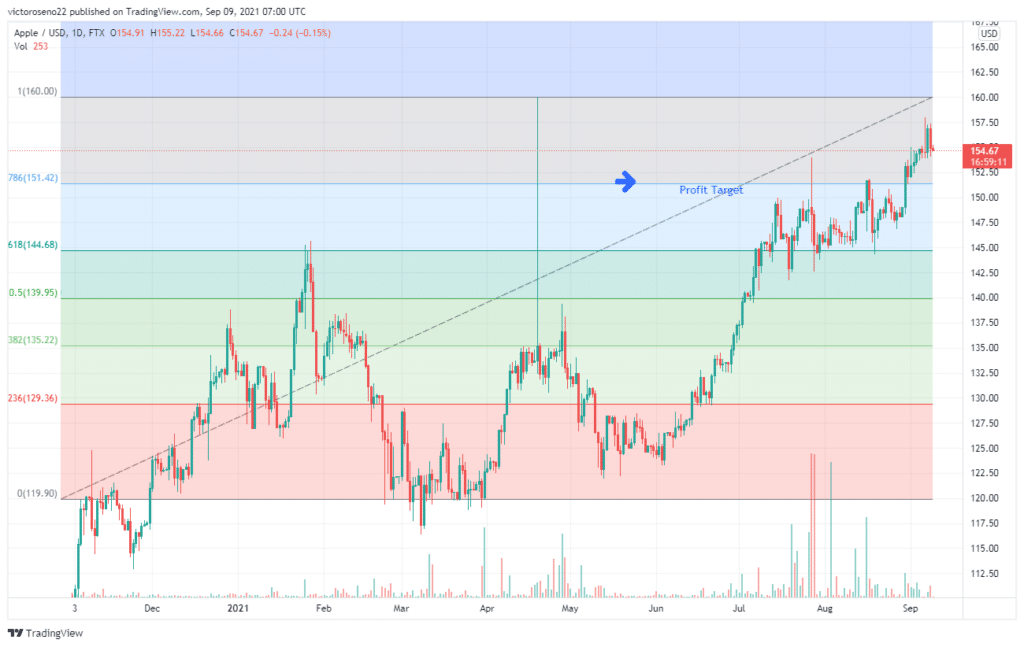
Fibonacci extension levels
This tool can work for an investor to give a clear picture of the point at which a price impulse wave can extend to. This happens at the onset of a fresh pullback or a clear reversal.

Traders can use Fibonacci extension levels, especially the 129.3%, 135.2%, 144.6%, and 160.0%, to estimate their profit targets.
Chart patterns forecasting price levels
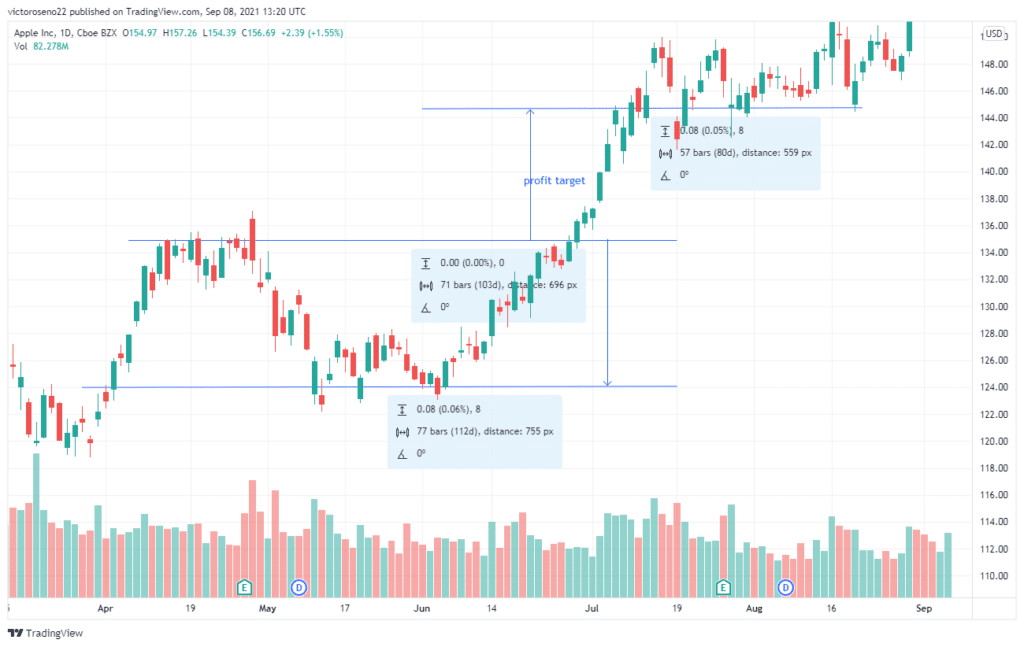
There are several sorts of chart patterns available on the market. When trading equities, these patterns can be utilized to predict a possible profit objective. Here we look at rectangular chart patterns.

In the chart above, the market is in an uptrend. We buy at the breakout of the pattern’s upper boundary. To set the profit target, traders can add the rectangle’s height to the entry point.
Strategy signals
Investors employ trading techniques to choose the point at which they want to make money.
This might be when the strategy provides an exit signal or when a unique market occurrence signals to the trader that it is time to close their position.
Order flow signals
Order flow is utilized by investors trading in large numbers of stock to know the most appropriate point for their profit goals. Other investors who trade under institutions can access the order flow from the level 2 market.
This gives them the ability to look at the order volume at each price level. These kinds of investors have to focus on a price level where orders that are in contrast to theirs can absorb their position.
Volume profile
The volume profile charting approach attempts to predict the volume invested at each price level.
The greater the trade volume at a given level over a period of time, the more probable that level will function as support/resistance.
As a result, analyzing volume profile charts might indicate the point at which the price is to be expected to change its movement to the opposite direction.
Final thought
The risk/reward of a trade is planned before the transaction is even executed by establishing a stop loss and profit goal.
Based on a chart, the trader understands that their profit objective is in a favorable spot. If the trader capitalizes on a predicted move, they will make a respectable profit on the deal.
Profit targets may not be reached. The price may move toward the profit target but then reverse, hitting the stop loss instead.
In general, the further your profit targets are, the lower the win rate you’re likely to have.


