TradingView is a leading platform that helps people conduct price action, technical and fundamental analysis on thousands of assets from around the world. The platform is widely used in the financial industry.
According to SimilarWeb, it is the 13th most popular website in finance and industry and is visited by more than 136 million. Also, its charts are used by hundreds of brokers. In this article, we’ll look at five of the best hidden tools in TradingView that you should try.
Pine Editor
Algorithmic trading is an important concept in the financial industry that helps people to automate their trading through bots. A bot combines several tools to work. For example, if you are a day trader who uses the double moving average crossover strategy, you can build a bot to automate this process.
Developers use computer programming languages to build these robots. There are those who specialize in Python and others who use Javascript. Most MetaTrader programmers use the native MQL5 and MQL4 languages. On the other hand, TradingView has developed its own native language, known as Pine Script.
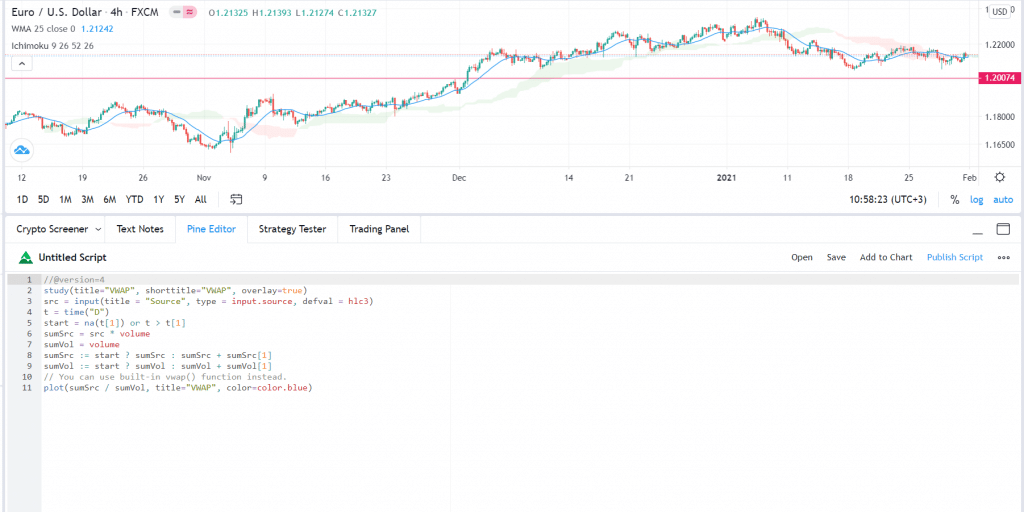
And on the TradingView platform, there is a Pine Editor tool where you can build your own robots. Most importantly, you can also build your own technical indicators. To do this, we recommend that you start by reading the Pine Script manual. The chart below shows the Pine Editor section in TradingView.
Pine Editor section
Strategy Tester
Back-testing is one of the most important foundations of day trading. It refers to the process of using historical data to test out whether your strategy is working. The idea is that if your strategy worked in the past, it would work in the future.
TradingView has a tool known as Strategy Tester that helps traders and developers to test their trading robots. Ordinary traders can also test the thousands of scripts that are available in the public library.
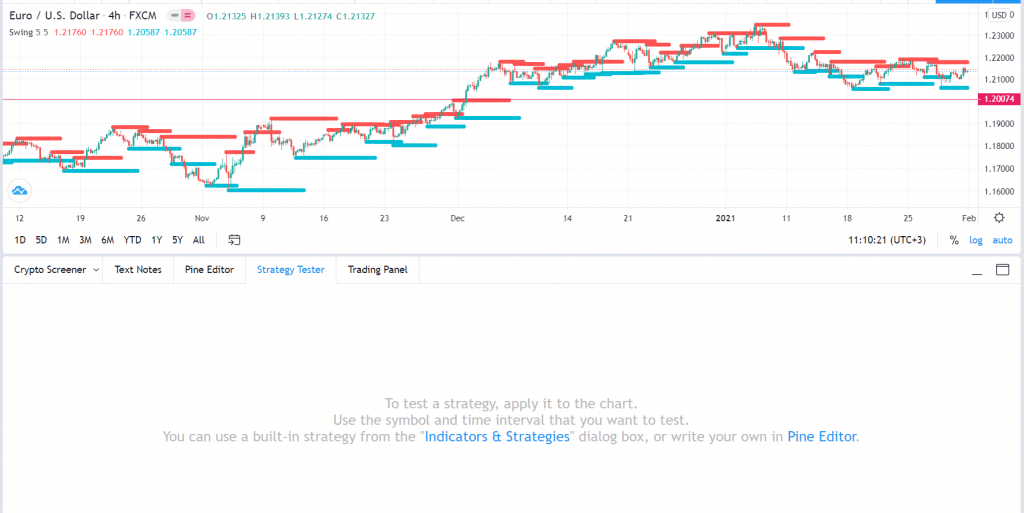
Using the Strategy Tester is relatively simple. First, you need to select it, as shown in the chart below. Second, you need to select the tool that you want to test. You can select a general indicator like the Relative Strength Index (RSI) and Moving Average. You can also select a pre-built strategy that is in TradingView.
Third, you should select the currency or financial asset that you want to analyze and the exact timeline you want to assess. For example, if you are a scalper, it will be unwise to test an indicator or bot on a daily or weekly chart. Similarly, if you are a stock trader, it is unwise to test the strategy using a currency pair. The chart below shows where you can find the Strategy Tester.
Strategy Tester in TradingView
Screener
As mentioned above, TradingView offers thousands of financial assets like cryptocurrencies, stocks, indices, commodities, cryptocurrencies, and exchange-traded funds (ETFs).
As a day trader, going through all these assets is relatively difficult. Therefore, having a system that analyzes thousands of products and looks at tens of items can be helpful. Fortunately, TradingView has a screener tool that simplifies all this and can be very helpful.
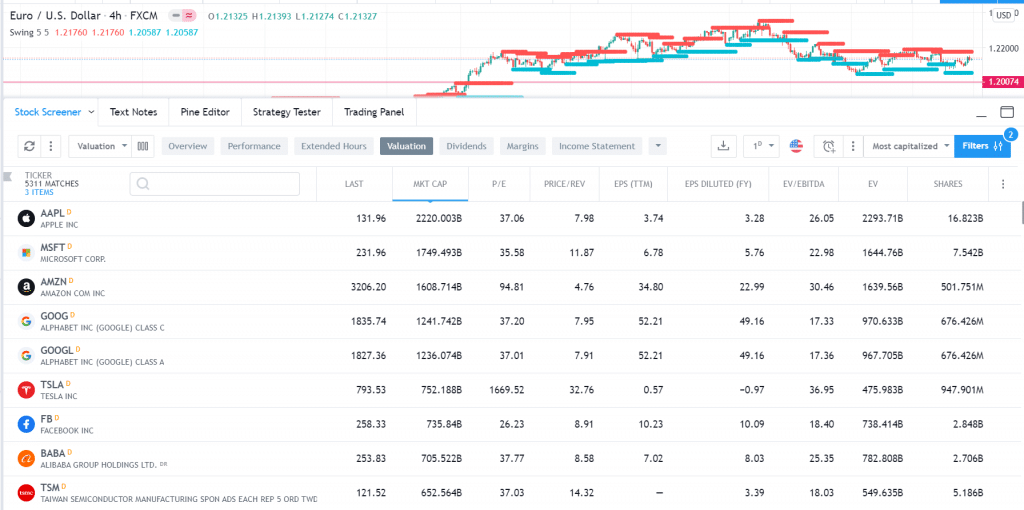
There are three primary screeners in TradingView. First, there is the stocks screener that narrows down thousands of stocks from around the world. Some of the useful criteria you can screen these stocks for are market capitalization, price to earnings ratio, dividends, margins, income statement, and balance sheet. For example, the stock screener below ranks stocks based on their market cap.
Stocks screener in TradingView
Second, there is a crypto screener that looks at thousands of cryptocurrencies. It ranks them based on the technical indicators, performance, market capitalization, and oscillators. The chart below shows a crypto screener in TradingView.
Crypto screener in TradingView
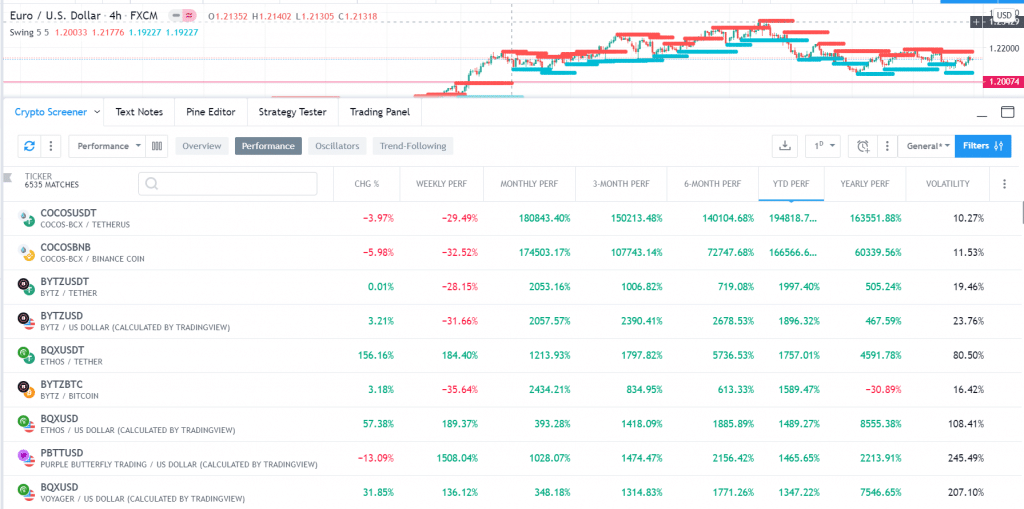
Finally, TradingView has a forex screener that can also save you a lot of time. You can narrow your options by looking at currency pairs at their all-time or 52-week highs or those that are above the moving averages.
Notes
A day trading diary or journal is a priceless tool that most successful traders recommend. The diary will help you anticipate moves and assess your general performance. Also, indirectly, it is an important risk management tool in trading.
People use trading diaries and journals differently. There are those who use them to note all their entries and their reasons for entering them. Also, there are traders who use them to write down their thoughts on the market.
Many day traders write these diaries and journals on a piece of paper. While this is good, books are usually not backed-up, meaning that they can easily get lost. Other people use mobile apps like Evernote and Google Keep.
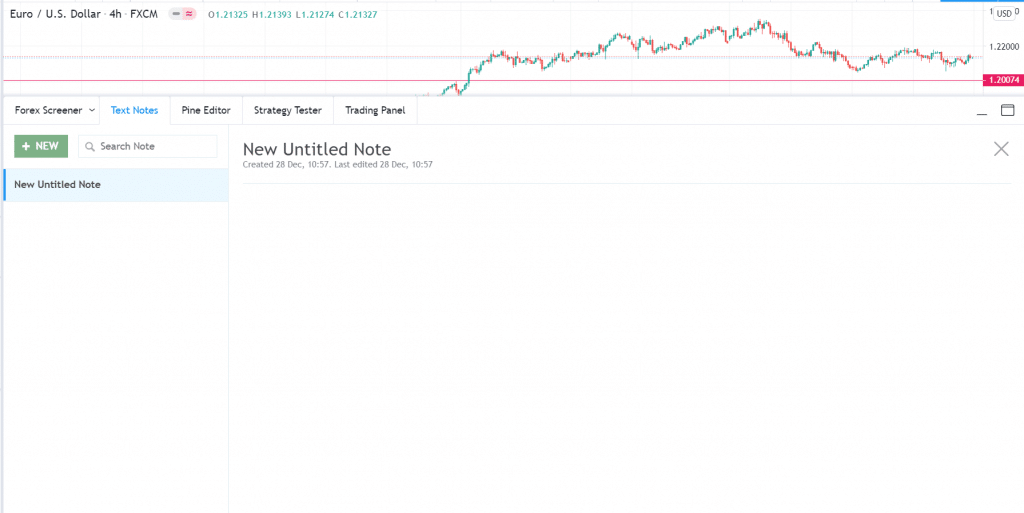
Others use the Notes feature offered by TradingView. This is a cloud-based feature that you can easily use to note down your thoughts and journalize your ideas. It is useful because you will always have it with you, and it is relatively easy to use.
Notes in TradingView
Streams
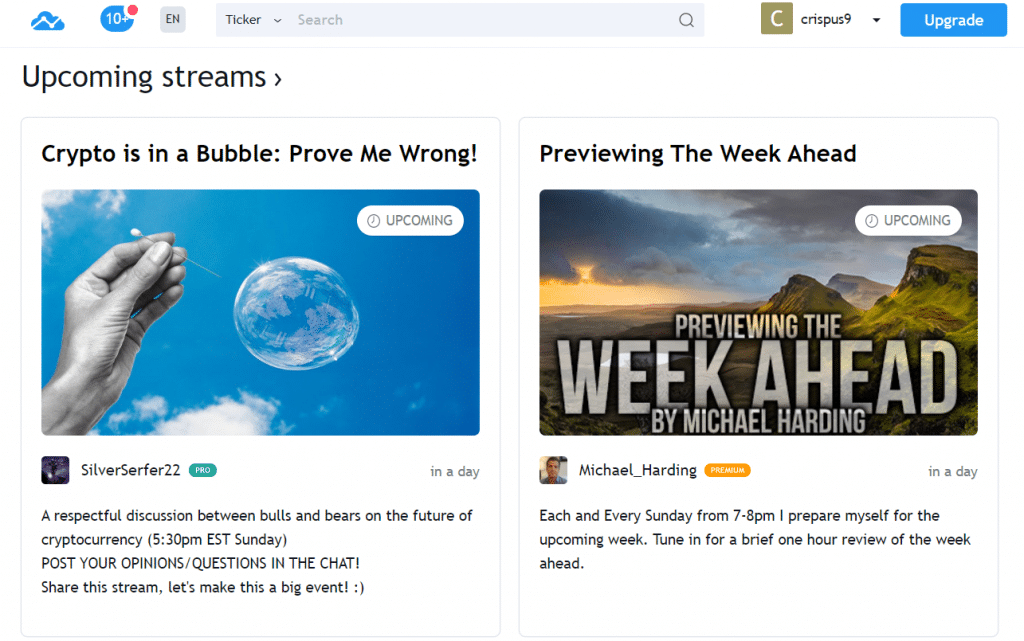
TradingView is not only a trading and charting platform, but it is also a social platform with millions of users who contribute to it every month. One of its recent features is known as Streams, which is basically a place where you can see other people trade. If you are a new day trader, streams can introduce you to live trading. If you are an experienced trader, you can learn more and boost your knowledge. The chart below shows the Streams page.
Streams in TradingView
Summary
TradingView has many rich features. In fact, we have just barely touched the surface. There are thousands of inbuilt and custom technical indicators, tools like Fibonacci Retracement and Andrews Pitchfork, patterns like the Head and Shoulders, economic calendars, alerts, hotlists, and news. Fortunately, TradingView is also a simple-to-use tool, meaning that you can learn about it in a short period.

