Candlestick patterns are useful tools used in the forex, stock, exchange-traded funds (ETFF), and commodities market. They are mostly used in technical analysis and price action trading strategies to predict the direction that an asset will take. According to Steve Nison, the writer of Beyond Candlesticks, these candlestick patterns started being used more than 100 years ago in Japan.
In this article, we’ll look at some of the best patterns in forex that you could have missed. The hope is that you can use this knowledge to identify similar patterns in the future.
Bullish engulfing pattern
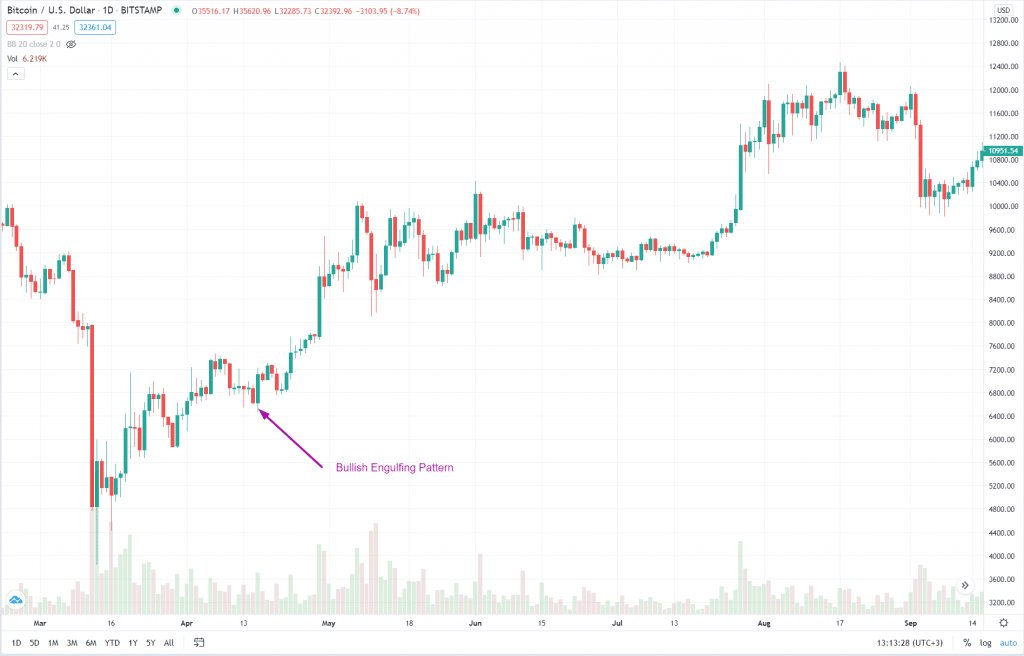
The bullish engulfing pattern is a reversal that happens at the bottom of a long bearish trend. It forms when a relatively small bearish candle is completely covered by a bigger bullish candle. The pattern usually implies that bears have started losing momentum and that there are some who have started to exit their positions. As they do this, more buyers come in and attempt to push the price higher. The result is that the second candlestick is usually bigger than the initial one.
A good example of a bullish engulfing pattern is seen in the BTC/USD pair shown below. The four-hour chart shows that the pair was in a falling trend for a few days. This trend ended when a smaller red candle was followed by a blue one.
Bullish engulfing example
The opposite of a bullish engulfing pattern is known as a bearish engulfing. It usually forms when, in a bull run, the price of a financial asset forms a small bullish candle followed by a large bearish candle that completely covers the bullish candle.
The lower and upper shadows of the bullish and bearish candles are important because they are used to put a stop loss.
Doji
A Doji is a candlestick pattern that illustrates the battle between buyers and sellers in the market. When the asset opens and closes at the same level, the pattern forms, signaling that the two parties have no control of the market. While a Doji pattern typically has no body, in some instances, it can have a small body.
There are five main types of Doji patterns. The standard one looks like a plus sign. The long-legged Doji has a long lower side and a short upper side. It signals that the candlestick moved up and down but closed at the same place where it opened.
The Dragonfly Doji has a long lower shadow and no upper shadow. It signals that the ore price opened, declined, and then ended the day at the same level where it opened. The gravestone Doji is the exact opposite of the Dragonfly Doji.
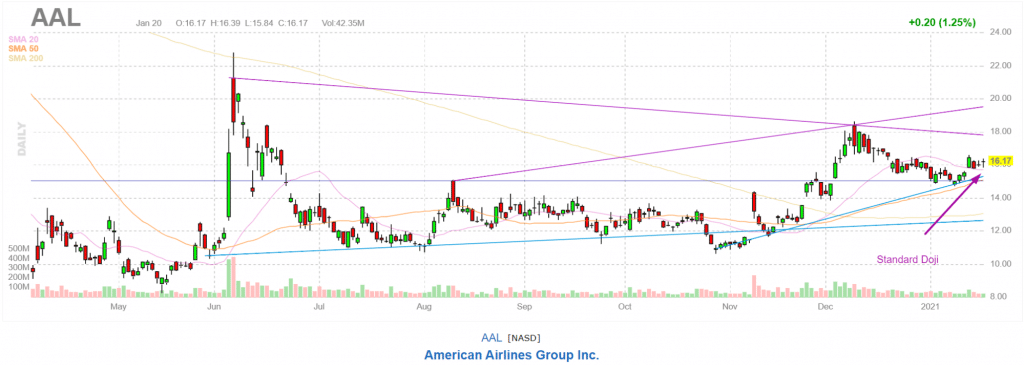
A Doji pattern is usually a reversal pattern that happens at the top of a bull run or at the bottom. When it happens, it often leads to a price reversal, as shown in the American Airlines stocks below.
Doji pattern example
Hammer pattern
A hammer pattern is a bullish pattern that forms at the bottom of a bullish trend. It is characterized by having a small body and a long lower shadow. In most cases, the candlestick does not have an upper shadow. As the name suggests, it resembles a real hammer.
The hammer pattern means that the price of an asset opened lower and then met some resistance from the buyers, who pushed it higher. In other words, the buyers outdid the sellers. While the size of the hammer does not always matter, when it has a long shadow and a small body, it provides a better reversal signal.
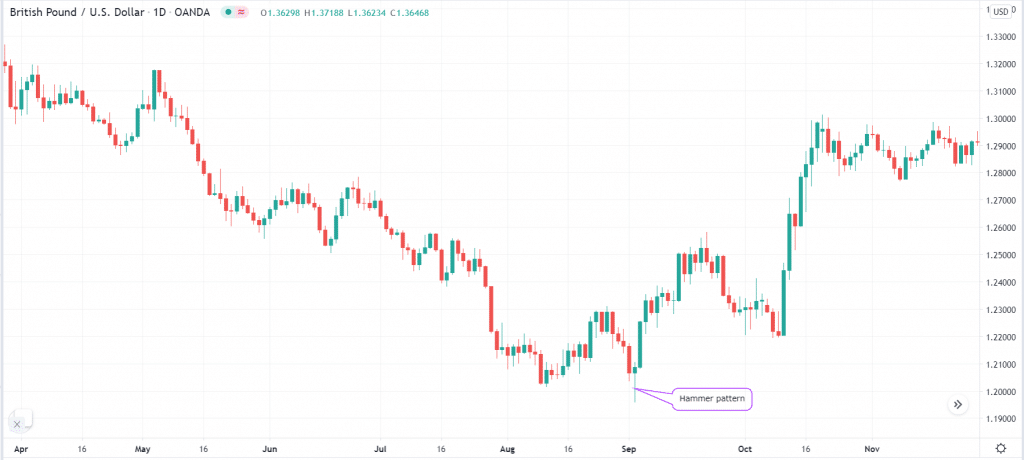
A good example of the hammer pattern that you missed is in the GBP/USD pair below. As you can see, the pair was in an overall downward trend when the hammer formed. After that, the price started a new upward trend. In most cases, traders use the lower side of the hammer as a stop loss level. It is assumed that if the price moves below that level, it will continue falling, which is a bit risky.
Hammer pattern example
At times, the opposite of a hammer – also known as an inverse hammer – can happen. This happens when the price opens, then rises, and then closes near the opening price. Similarly, that is usually a reversal pattern.
Shooting star pattern
The shooting star pattern resembles a hammer pattern. The only difference is that it happens during an uptrend. Also, it usually has three essential candlestick patterns, with the middle one being the star. The first candle needs to be relatively long and is followed by another one that opens higher but closes lower. This signals that bulls are losing the momentum. The final candlestick is usually bearish as a way of confirming that bears have prevailed. A good example of this pattern is shown below. As you can see, the price continued to decline after its formation.
Shooting star pattern
Morning star candlestick pattern
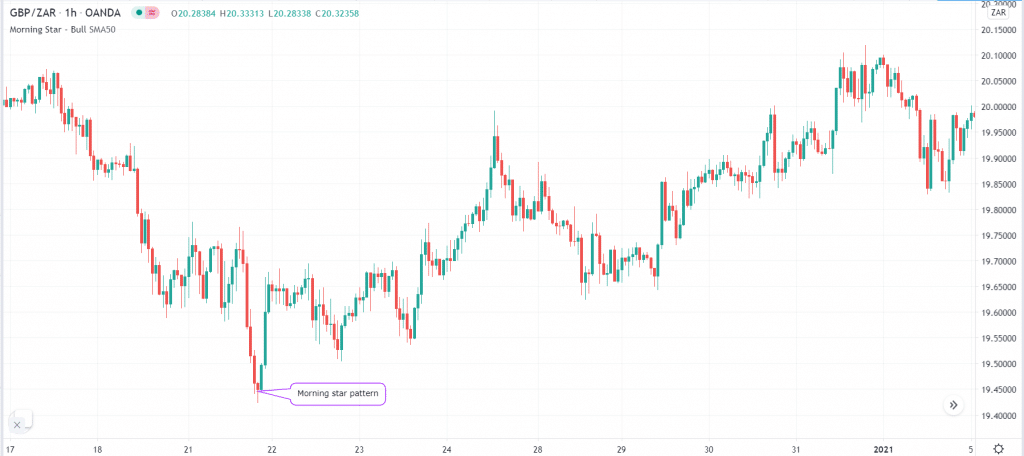
The morning star candlestick pattern is formed by three candlesticks and is usually a sign of a reversal in the market. The first candlestick is usually a long bearish candle. It is then followed by a small bearish candle that sends a signal that the downward momentum is losing steam. It is then followed by a relatively bigger bullish candlestick. To validate the reversal, you should watch for the next two candlestick patterns. An example of this is in the GBP/ZAR chart below.
Morning star example
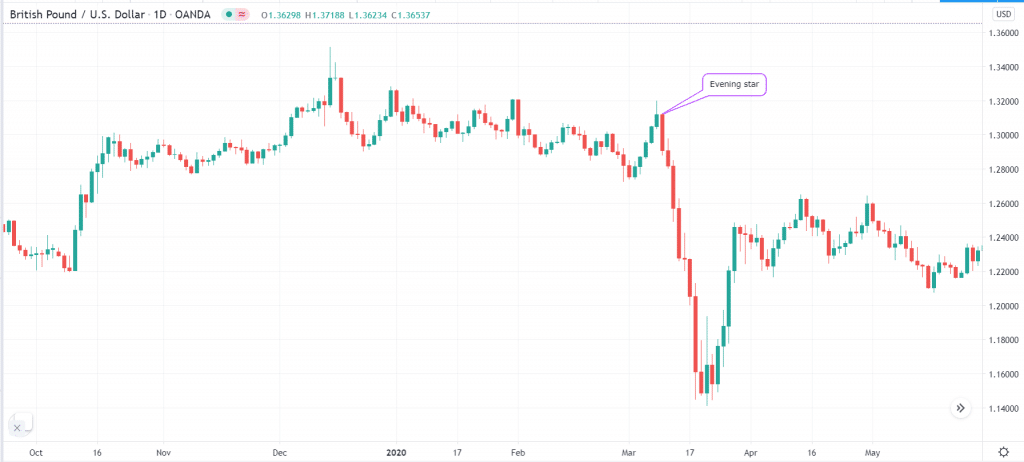
The opposite of the morning star pattern is the evening star. It is usually a bearish reversal pattern that starts with a long bullish candle followed by a small bullish candle and then a long bearish candle.
Summary
Candlestick patterns are useful arrangements that are exploited by market technicians and price action traders to determine entry points. When used well, these patterns can tell you when to buy or when to sell. In this article, we have looked at five of the most popular ones that you can use. Still, there are others that we have not covered, including the harami, piercing, three black crows, and the three white soldiers.

