Chart patterns are formations that help traders practice the price action strategy. These patterns are useful because of how accurate most of them are. Also, they help traders identify buying and selling opportunities without having to use technical indicators like moving averages, Donchian channels, and the Relative Vigor Index. In this article, we will look at five chart patterns you probably missed in forex and help you identify them in the future.
Channel and channel breakout
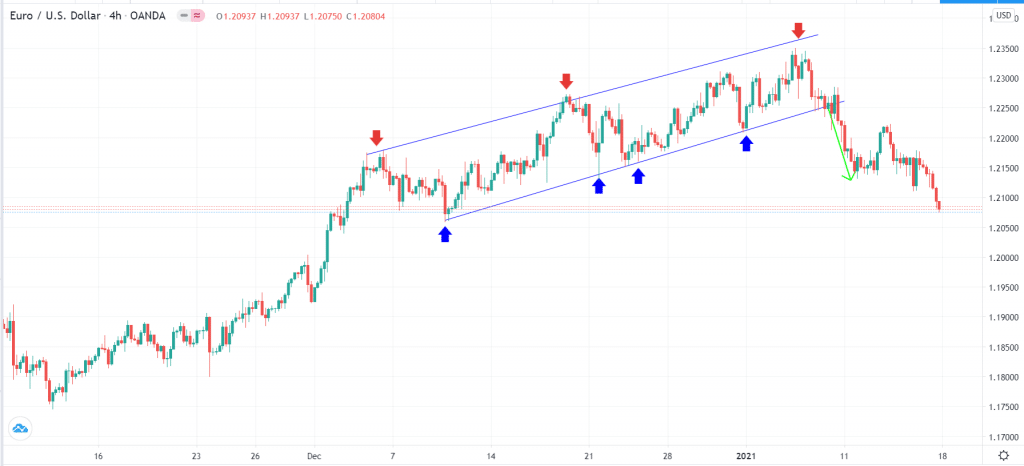
A channel refers to a situation where a forex pair forms two parallel lines. The two lines are drawn by connecting the highest and lowest swings of a currency pair. A channel can be horizontal or diagonal. It can be rising or falling. It can also be small and large.
A channel has three main trading opportunities. In most cases, you can place a buy trade when the price reaches support and sell when it reaches the resistance level. Also, you can buy or sell the asset when the price is about to experience a bullish or bearish breakout pattern.
A good example is in the four-hour EUR/USD chart shown below. In it, the blue arrows are ideal buying locations, while the red arrows are excellent shorting locations. The explanation of this is relatively simple. The support happens when there are not enough sellers to push the price lower. Similarly, the resistance occurs when there are not enough sellers to push it higher.
The green arrow shows the bearish breakout. Ideally, all channels will always have a bullish or bearish breakout. This happens when the bulls and bears prevail and push the price in their direction.
Channel and channel breakout
One of the best approaches to trading channels and breakouts is using pending orders like buy and sell stop and buy and sell limits. These trades will help you avoid false breakouts, which are always popular.
Bullish flag
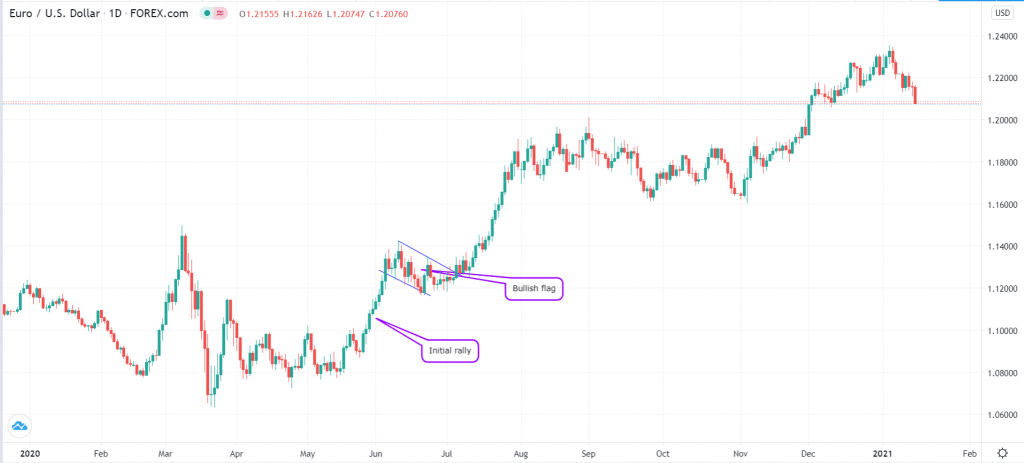
A bullish flag is another popular candlestick pattern that happens when the price of a currency pair is rising. Ideally, when the price is rising, it will reach a point where some bulls start leaving. This will, in turn, reduce the amount of demand and slow the rally.
A bullish flag is a relatively small channel that forms during this rally. In most cases, it breaks out higher since the original reason for the rally has not changed. An example of this is in the EUR/USD chart below. As you can see, ultimately, after the bullish flag, the price continued with its original rally.
Bullish flag example
The opposite of a bullish flag is a bearish flag. It happens when a bearish rally slows, leading to a small channel and then a bearish breakout.
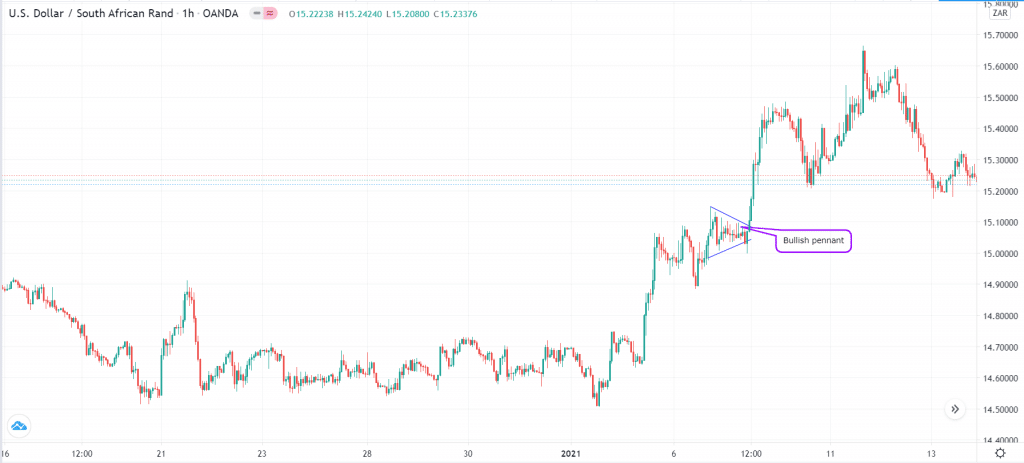
At times, the consolidation will not be in form of a channel. Instead, it will resemble a small triangle pattern. When this happens, the bullish or bearish consolidation is known as a pennant.
Bullish pennant example
Triangle pattern
A triangle pattern is also a popular arrangement in the Forex market. As the name suggests, it resembles an ordinary triangle pattern with its three sides. The formation happens when there is a tussle between buyers and bears in the market about the future direction of an asset.
There are three main types of triangle patterns in forex: ascending, descending, and symmetrical. In an ascending triangle, there is an initial resistance where the price struggles to move above. The price then forms a rising trendline but struggles to move above the resistance. In most cases, the price usually breaks out higher.
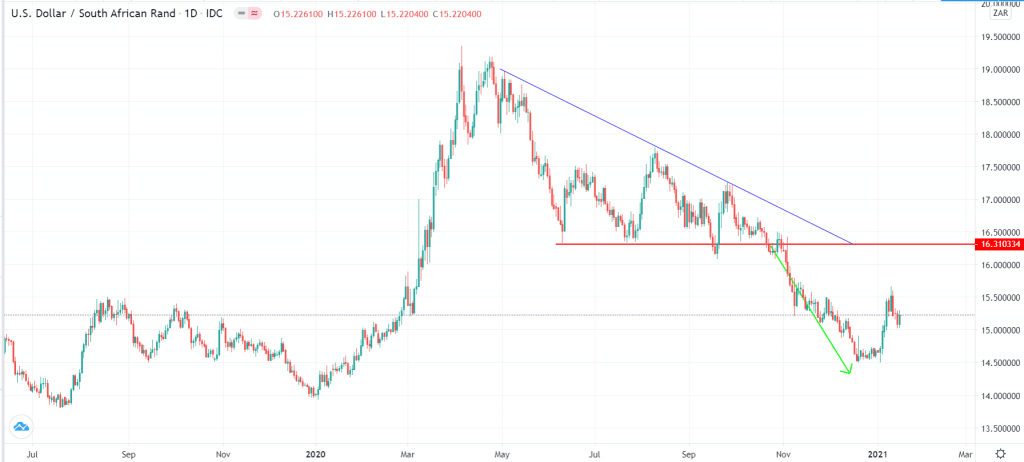
A falling triangle pattern has flat support and a descending trendline. It is the exact opposite of an ascending trendline. In most cases, it usually breaks out lower.
An asymmetrical triangle forms when there is an indecision in the financial market. It forms when the currency pair forms two converging lines with an equal slope. In this, the breakout usually happens in either direction when the triangle forms a peak.
The chart below is a good example of a descending triangle on the USD/ZAR pair.
USD/ZAR with a descending triangle
Head and shoulders pattern
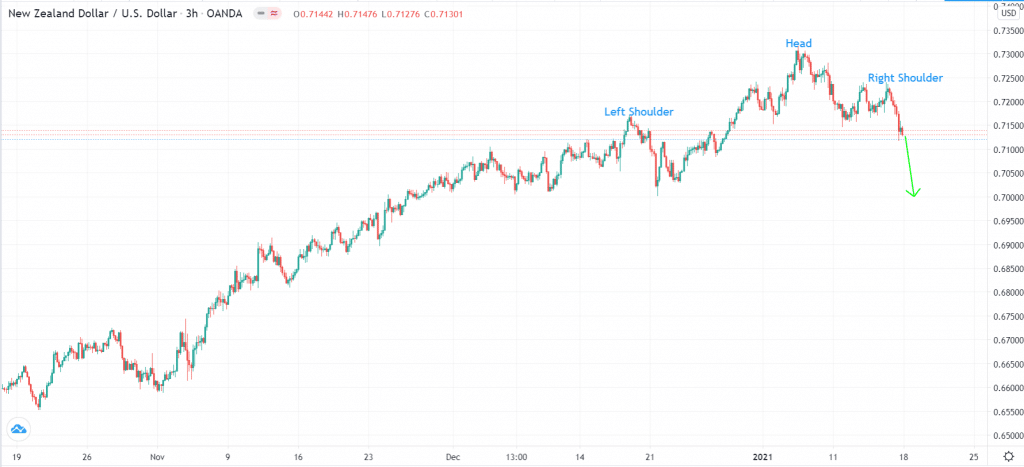
The head and shoulders pattern is another popular chart pattern you could have missed in your forex trading. Its name is self-explanatory: it is formed when a bullish trend is coming to an end. As the name suggests, it has a head, two shoulders, and a neckline.
The left shoulder forms when the first peak happens, leading to a pullback. After the pullback, the price then goes up above the first peak, forming the head. After this, the price drops to the neckline and then goes up slightly above the left shoulder. Finally, the price usually drops below the neckline. In most cases, the bearish breakout is usually the same size as the distance between the neckline and the head.
Head and shoulders example
Double bottom
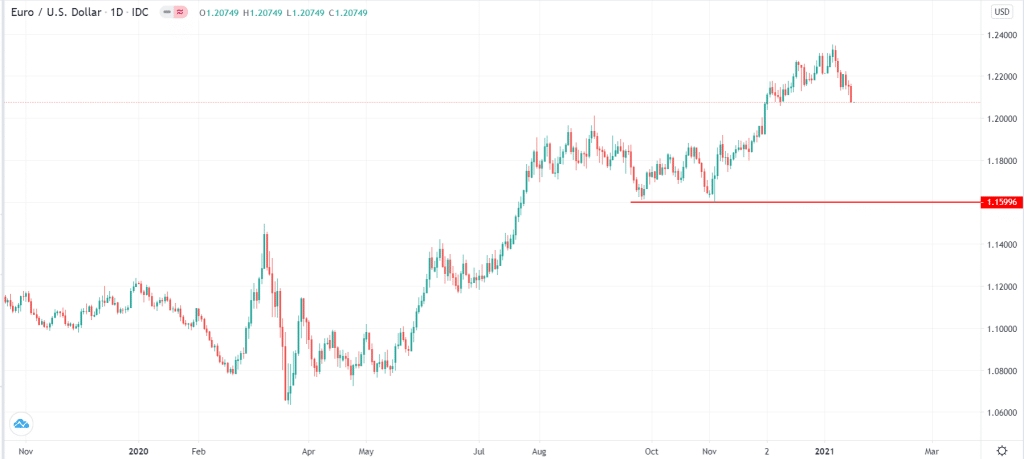
A double bottom happens when the price of a currency pair drops and hits a key level and then rises again. But bulls are no longer strong enough to sustain the rally, pushing the price lower again. It then hits the first support but struggles to move below. When this happens, it is usually a sign that there are not enough bears to push the price lower. Subsequently, it leads to a bullish reversal. The opposite of a double bottom is a double top and is usually a bearish reversal. The chart below shows an example of a double bottom in the EUR/USD pair.
EUR/USD double bottom
Summary
Chart pattern analysis is the most important strategy when you are trading forex, stocks, commodities, ETFs, and any other asset class. These chart patterns happen all the time and are usually great pointers of what will happen in the future. In this article, we’ve looked at some of the patterns that you probably missed before.
Fortunately, they will happen again, and you can take advantage of that. Other popular patterns are wedges, cup and handle, inverted cup and handle, rounding bottom, and triple bottom and top reversal pattern.

