Chart analysis is the backbone of forex trading. In fact, the most successful day traders are those who have mastered the art and science of analyzing the charts. Yet, with the benefit of hindsight, many traders often miss charts with excellent formations. In this article, we’ll look at some of the best indicators in charts that you missed in forex. The goal of doing this is to help you identify trading opportunities in the future.
Moving average crossovers in the USD/ZAR pair
Moving average is, without a doubt, one of the most important technical indicators in the financial market. In fact, many other indicators like the Bollinger Bands, Donchian Channels, and Envelopes have been developed using its concepts.
For example, the middle line of the Bollinger Bands is usually the period’s moving average, with the two other lines being the standard deviations.
Traders use the moving averages differently. Some use it in trend following, where they view a breach of the average as a sign of possible reversal.
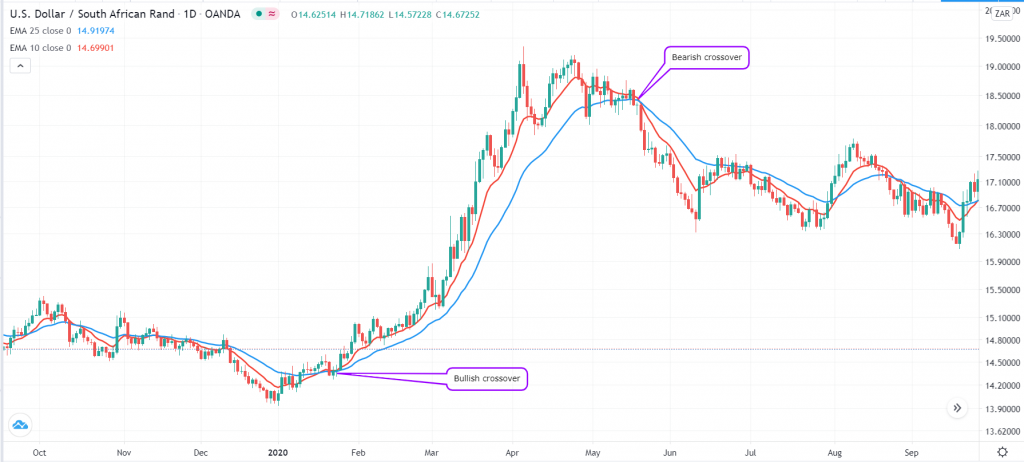
Others use the averages as a way of identifying areas of potential reversals. In this, a common approach is to use two moving averages with different periods. As such, if the two make a crossover, they view it as a confirmation of a new trend.
Long-term traders typically use the 200-day and 50-day moving averages. A bullish crossover of the two is known as a golden cross, while a bearish crossover is known as the death cross. Short-term traders, on the other hand, use shorter-timeframes to identify these opportunities.
In the USD/ZAR pair below, we see bullish and bearish crossovers that could be easily missed in 2020.
RSI Overbought conditions in USD/NOK
The Relative Strength Index (RSI) is another popular oscillator that is mostly used to identify overbought and oversold situations. Typically, an overbought condition sends a signal that it is time to short an asset. Similarly, oversold conditions are indications to buy a financial asset.
Developed by Welles Wilder, the RSI is calculated by first calculating the average gain and loss and smoothing the data with the average gain and loss. In most cases, the most popular period used is 14.
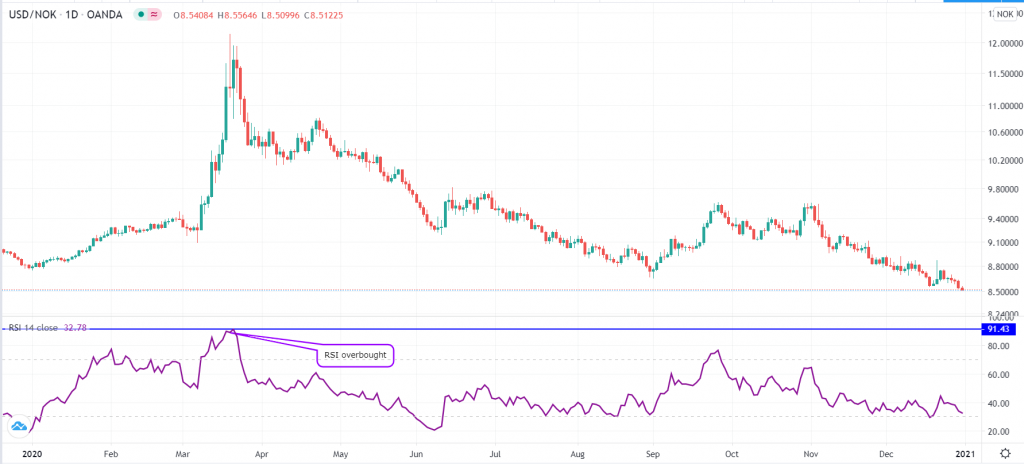
In March 2020, during the early days of the coronavirus pandemic, the US dollar rose to multi-year highs against most currencies. The Norwegian krone was one of them.
As it did this, the 14-day RSI, on a daily chart, moved to a severely-overbought level of 90. This was the highest it had been in more than a decade. Therefore, those who sold the currency short made substantial profits, as shown in the chart below.
RSI on the USD/NOK pair
Bollinger Bands squeezed ahead of a Breakout
Bollinger Bands is a popular trading indicator in the forex market. In fact, it is provided as a default by most forex brokers. It is also available in the MetaTrader and TradingView platforms.
As mentioned above, Bollinger Bands is calculated in a relatively simple way. First, you get the moving average of a certain period, which is often 20 days. Second, you calculate the positive and negative standard deviation of the price.
Traders use Bollinger Bands in various ways. One of the most popular approaches is in trend following. When the price of an asset is rising, traders look at the middle line of the bands. In this, the bullish trend will continue so long as the price is between the upper and the middle bands.
Similarly, when the asset’s price is falling, the bearish trend is confirmed so long as the price is between the middle and the lower lines.
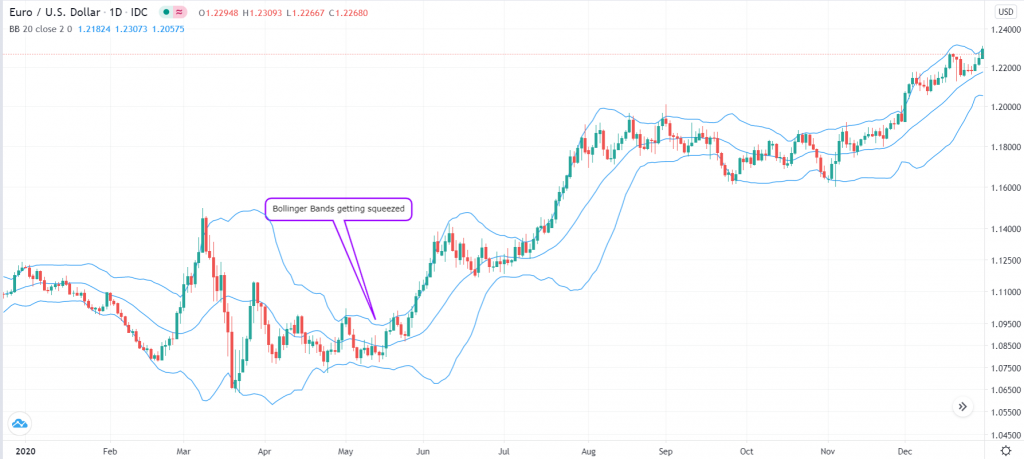
Another approach to using the Bollinger Bands is to look for a squeeze. This happens when there is a consolidation, which brings the three lines of the bands closer. In most cases, this is usually a sign that a break-out in either direction will happen. A good example of this is shown in the EUR/USD chart below.
MACD crossover on the USD/TRY pair
The Moving Average Convergence Divergence (MACD) is another popular indicator. As the name suggests, it is derived from the concept of moving averages. In its calculation, its goal is to turn moving averages into an oscillator.
The MACD is calculated in a relatively simple way. First, to get the MACD line, you subtract the shorter exponential moving average from the longer-term EMA. In most cases, the most-used periods are 26-day and 12-day moving averages. Second, you get the moving average of the MACD line. Typically, you use the 9-day period.
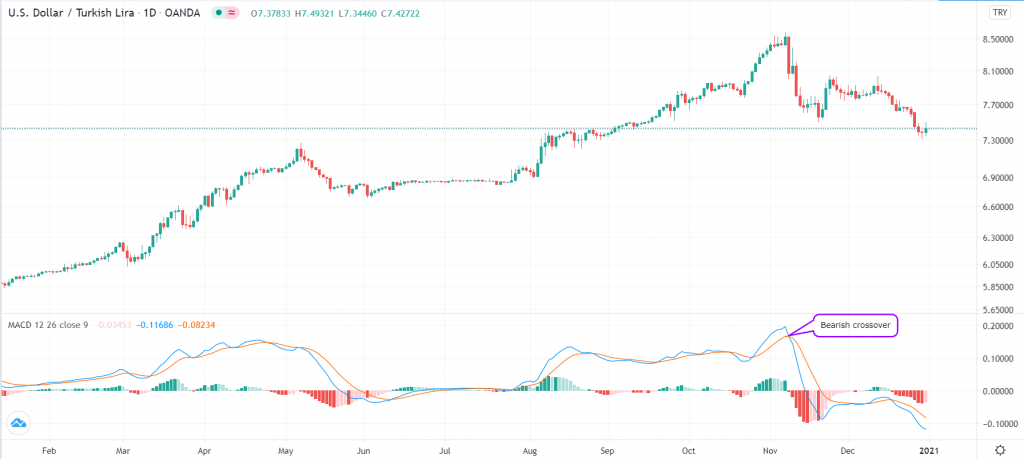
There are several strategies for using MACD. One of them is to find entry positions when the MACD and the signal lines make a crossover. A bullish signal emerges when they cross-over below the neutral line and vice versa.
In the chart below, we see that the two lines crossed each other in November 2020, leading to a new bearish trend.
MACD crossover in the USD/TRY pair
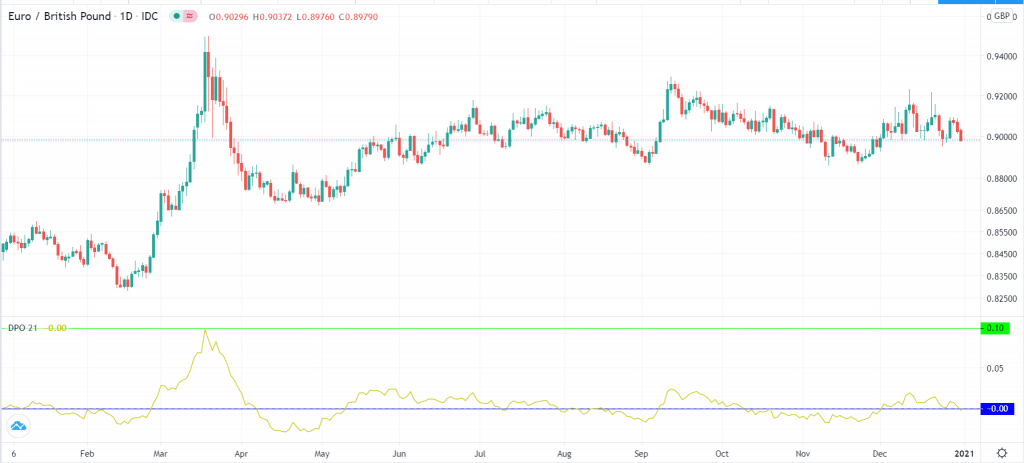
Detrended Price Oscillator (DPO) on the EUR/GBP
The DPO indicator was created to remove trends from the price and simplify the process of identifying cycles. Unlike most other indicators, it does not extend to the last date because it usually displaces the average. The indicator is calculated using this formula:
DPO = {X/2 + 1} periods less the X period SMA
The DPO usually moves between -1 and +1, with zero being the neutral level. When it moves substantially higher, it is said to be in the overbought zone, while when it is sharply lower, it is said to be in the oversold level. In the EUR/GBP pair, we see that the DPO indicator rose to a multi-year high of 0.10 in March 2020. Being overbought, the pair started a major downward trend.
DPO indicator on the EUR/GBP pair
Summary
Did you miss any of those trades? You are not alone. Indeed, looking back, all traders and investors have missed trading opportunities in the past. The secret is to use these missed opportunities to find other potential opportunities in the future.

