The Aroon indicator’s up and lower lines swing in the range of 0-100, and the strength of the trend increases with the rise in its value. Normally, the number of periods for this indicator is 25, and the up and lower lines are inversely proportional to each other. When the value of the indicator is high, it is a sign of a bullish trend, while a bearish trend is indicated when the value is low.
When the Aroon indicator crosses the baseline, it essentially indicates that the lower line is being crossed by the upper line. Thus, traders will know that the price high has occurred more recently than the price low, which is an indication of a bullish trend. Conversely, when the indicator goes below the baseline, it signifies that the low is more recent compared to the high, which signals a bearish trend.
Let us now take a look at the top 5 Aroon indicator charts you might have missed.
RSI, Stoch, SRSI, MFI, and Aroon
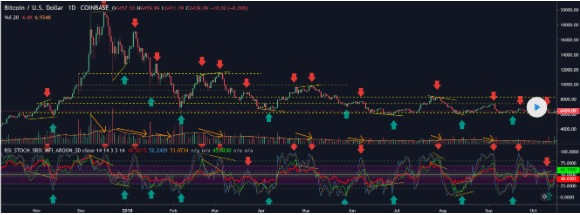
This strategy is created by combining the Aroon indicator with the Relative Strength Index (RSI), Money Flow Index (MFI), Stochastic Relative Strength Index, and Stochastic indicators. The basis for this complex strategy is a much simpler one consisting of overlaying Stochastic RSI, Stoch, and RSI lines. This one has additional bands that denote overbought and oversold regions, along with a middle line.
Here, the MFI, Stochastic, and RSI allow you to take a more prudent decision in regards to trend change predictions. The Stochastic RSI is highly likely to get exceeded or receded when it is overbought or oversold, although the volume and the nature of trend progression must be closely monitored as well. You need to make sure the trend continues, and the value of the Stochastic RSI is more than 80 or less than 20 while looking for reversal zones using divergences.
On the chart above, you can see some notable divergences, along with Stochastic highs and lows and convergences in the middle of the MFI/RSI and Stochastic on a few highs and lows that are extended too much, thus being potential reversal zones.
The Relative Strength Index resistances are depicted, and they don’t exceed 60 or the neutral area. When the value of the RSI is over 60 routinely, it depicts an uptrend, while a downtrend is indicated when it is less than 40.
Aroon and EMA crossover
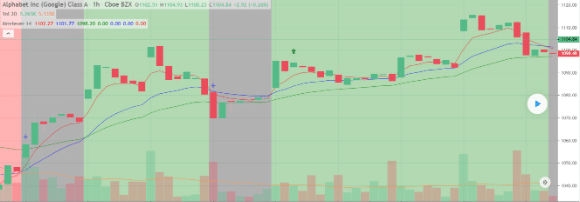
This strategy consists of the Aroon Indicator, along with 3 EMAs (Exponential Moving Averages) with periods of 5, 15, and 30. The stop loss should be placed beneath the daily low/high, and after the achievement of the profit target, it must be trailed tightly. The profits ought to be booked at points that are twice or thrice the stop loss, and overnight positions should be avoided at all costs.
You can enter a buying position based on two rules. The first one is that the upper line intersects the lower line, moving upwards, while the EMA with five periods exceeds that with 15 EMA. The second rule is that the upper line exceeds the lower line and that the 5 EMA intersects and moves up the 15 EMA.
On the other hand, the sell entries occur when the upper line intersects the lower line from above, and the 15 EMA exceeds the 5 EMA. Another sell rule is that the upper line lies below the lower line and that the 5 EMA intersects the 15 EMA from above.
Aroon, EMA, Laguerre RSI, and DMI
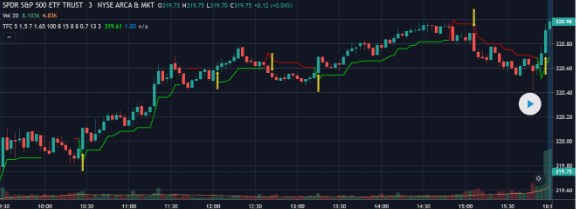
This oscillator is a combination of a couple of indicators, one of which uses a short time period for analysis, while the other one uses a longer period. The indicator can be seen on the chart after the combination, provided both the analyses show a one-way Supertrend.
The upward and downward pointing arrows show achievable signals for trade entries on the condition that 3 of the five oscillators show the trend direction to be the same as the long- and short-term indicators. These five indicators have adjustable parameters so that you can change them according to your needs.
Be careful not to select too low a value for the Indicator Threshold, as you will see the arrows appearing more frequently, with most of them being non-profitable. On the other hand, if the value is too much, very few arrows can be seen after the trend has lost most of its potential. The value should lie somewhere between two and four.
Simple Aroon
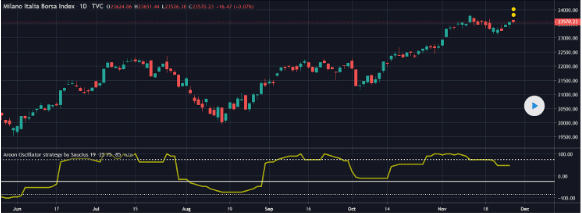
This is a strategy that is extremely suitable for an unstable market where the strength of the trend is low, and the future price levels are uncertain. The position should be taken using the middle line, while the extreme ones can be utilized for making short and long exits. However, you cannot use the latter for entering countertrend positions.
Aroon single line
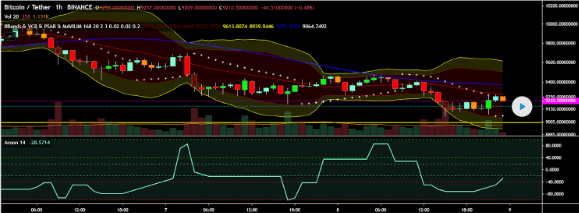
In this strategy, the double-lined Aroon oscillator is converted into one with a single line representing the difference between the upper and lower lines. If the indicator points at 100, it is a sign of a definite bullish trend. It is the same outcome when it lies between 40 and 100.
A trend is absent when the indicator swings between -20 and 20, presenting flat lines. A bearish trend is indicated when the value is 0, resulting from the upper line being equal to the lower line. A further indication of a bearish trend can be gotten when the value is in the region between -40 and -100, and when it reaches the lowest limit, the downward trend is said to be particularly strong.
Summing up
The similarities between the chart situations are as follows:
- They all deal with the Aroon upper and lower lines and the relationship between the two.
- They let you forecast the direction of the trend.
- They let you quantify the strength of the trend.


