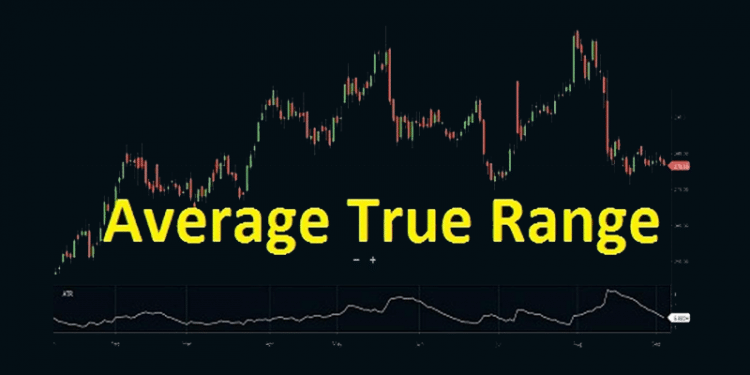
Average True Range lets merchants point out favorable entry positions. Traders dealing with short-term trends take the help of Average True Range breakout scenarios to make their entries. When the volatility of the instrument is high, the ATR value will be greater and vice versa.
Not only does this indicator allow traders to make entries and exits, but it also allows them to set a stop loss in order to keep the loss to a minimum in case of a price reversal. As a general rule, the stop losses are placed at a distance corresponding to twice the ATR value.
Thus, while buying an asset, the stop loss is placed beneath the opening price at a distance twice the ATR. Similarly, while selling, the stop loss should be placed on top of the opening price in the same way. Once after entering the long trade if you see favorable price movement, you should keep moving the stop loss to a distance of 2 * ATR.
MACD and Trailing ATR

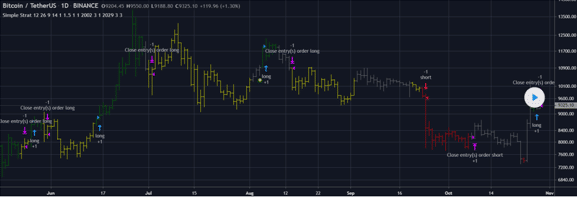
This trend-dependent scheme uses the crossing of simple and exponential moving averages to figure out in which direction the trend is heading, alongside Moving Average Convergence Divergence (MACD) for the trade entry indication. Simultaneously, it involves using the Average True Range as trailing stops.
Using this scheme, you can make an entry when the MACD line crosses over the line representing the signal, and the trend ribbon turns green. It also considers the pyramiding factor and lets you place the second entry in case the signal is repeated.
There are a total of three points here where you can make an exit. When the price rises by 1%, you ought to close 10% of your position and the next 50% when it increases by 5%. If the price closes beneath the Average True Range line, there is an exit indication that leads to the closure of the rest of your position.
Although the above chart is based on the Ethereum/Tether pair, you can use it with different crypto securities by adjusting the inputs.
MACD + RSI+ Stoch
This scheme combines three popular indicators, namely ATR, Stoch, and Relative Strength Index. As a general rule, you should enter a long trade when the MACD exceeds the signal line, and both the Stoch and RSI values are above 50. The stop loss, in this case, is placed at the peak of the preceding day.
The exit points are usually at the stop loss or profit limits that are determined by the Average True Range. This scheme is not suitable for scalping but very effective for day trading activities, so you can earn maximum profits. Once the MACD moves below the signal line, you can exit your trade.
2 Candles
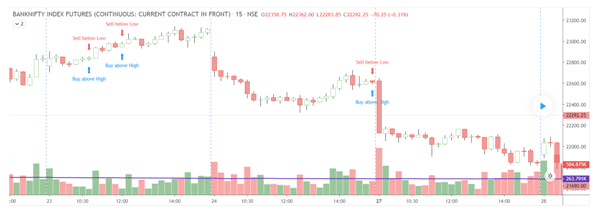
As a part of this scheme, we have a couple of candles inside the range of the Average True Range, probably lying in wait for a huge price swing to take place. At the combined high or low points, you can place the buy or sell orders with the stop loss being denoted by the other.
Once the price reaches the minimum stop loss, you can initiate a counter trade. But, prior to entering a position on the opposite side, you should stand by for the SL (Stop Loss) candle to close. This scheme is suitable for short-term charts with periods of 15 minutes or so, with the multiplier being 0.6 and the time-span of the Average True Range being 25.
ATR + MA
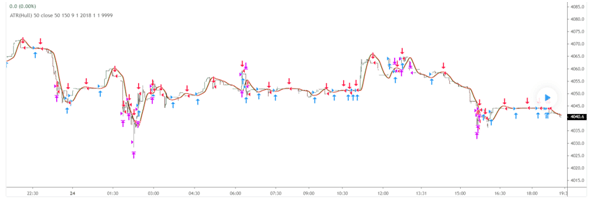
This strategy involves a simple ATR indicator that is smoothed with the help of a Hull Moving Average. Since the candles are supposed to be overlaid as per this scheme, their appearance is vastly different from a generic ATR. It is a 42.92% profitable strategy with a total profit of 11.56%.
If the ATR exceeds ATR[1], it is a good time to enter a long trade, and when the ATR value is less than ATR[1], a short entry is more viable. The long and short positions are depicted on the chart using the blue and red arrows, respectively. The exits should be made once the price reaches the stop loss or take profit levels.
1. ATR ADX
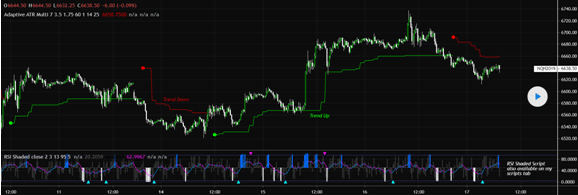
The strategy places the ATR stops on top of or beneath the price level and changes direction once the ATR stop is broken by the source price. Switching between Average True Range multipliers is done using the ADX oscillator. When ADX depreciates, it uses the lower multiplier, while an uptrending ADX requires the high multiplier.
When there is a trend in the market, the Average Directional Index scales cause the difference between the trailing ATR stop and the source price to increase. In the absence of a trend, the difference between the price and the Average Directional Index is lowered.
This stratagem is effective for trailing the price by adapting to the average change in direction and the price’s true range. In the event of a long trade, the stop lies beneath the price level and with its value not decreasing until it is intersected by the price. After this occurs, the stop may switch its direction and exceed the price, which is a short trade scenario.
A stop lying above the price line will not rise further until the price intersects it. Depending on the ADX and ATR changing, the stop will adjust its movement speed.
Summing up
We can notice the following similarities between the chart situations:
- They allow you to measure volatility.
- Using them, you can point out perfect positions for entering and exiting trades.
- They are suitable for day trading activities.
- They are based on calculating the successive highs and lows.
- A sudden rise in value for the ATR may not be the confirmation of a previous trend.

