Several traders use Bollinger Bands (BB) for finding relative highs and lows in the market. When the pair’s price moves beneath the lower BB, it is an indication that the prices have gone too low and should bounce back soon. Conversely, when the pair’s price advances beyond the upper BB, it indicates an overbought market where a pullback is about to occur soon.
When the trend is quite strong, however, you can place your trade on the opposite side since the oversold and overbought indications might be somewhat premature. Thus, you need to judge the price’s general direction beforehand. During a bearish trend, you should enter a sell trade upon the triggering of the upper BB.
You may use the lower BB as an exiting point if you wish, but a buy trade is not initiated because it opposes the trend.
BB Breakout

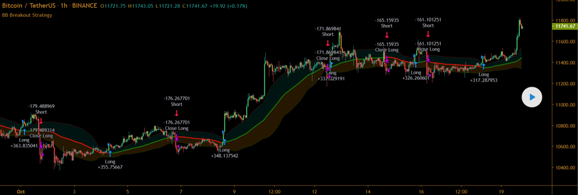
Here, we use the Bollinger Band indicator utilizing a 20-period simple moving average. The distance of the baseline from the upper and lower BBs is two standard deviations. For the Bitcoin/TetherUS pair shown here, you can find a visual representation of volatility and trend with respect to the price position.
While using this scheme, we don’t consider other factors like Relative Strength Index and Volume. So, you must use other fundamental and technical indicators alongside it. The outcomes of this scheme are due to the placing of buying and selling trades, and profit targets and stop losses are not considered.
The scheme can be used for following trends and consists of a few simple rules. If the preceding closing point intersects the upper band from below and goes up, you should place a buy trade. Conversely, if it falls beneath the lower BB, it is a perfect occasion to place a sell trade.
On the chart, you can see the long trades depicted by the upward-pointing blue arrows and the short trades indicated by the downward-pointing red arrows. The closing points for the long trades are represented by the downward pointing purple arrows.
Double BB

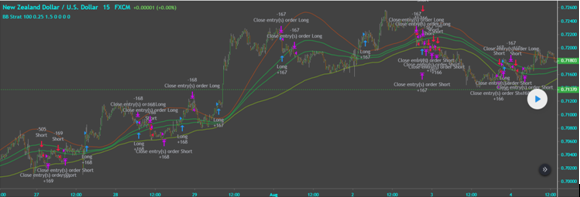
Here you can see a 15-minute chart for the pair NZD/USD. Two BBs are used for filtering entries and exits. As you can see, the buy trades are placed when the price exceeds the inner Bollinger Bands, and the outer Bollinger Bands expand. These trades are closed when the closing point of the price lies beneath the outer Bollinger Band.
For short trades, this rule is simply reversed. To elaborate on the rules, a trader wishing to buy the pair needs to look out for a candlestick to close at a point beyond the inner Bollinger Band’s upper band. After that, they should examine a preceding couple of candles to make sure the corresponding closing points lie beneath the inner Bollinger Band’s upper band.
If this holds true, it is the perfect occasion to place a buy trade. You need to place the stop loss at the lowest point of the candle that has broken the inner Bollinger Band’s upper band. The profit target should be set at a distance equal to 2 times the size of the stop loss.
MA Cross

In this scheme, we consider the Bitcoin/USD pair. The strategy consists of two independent schemes known as 2 Moving Averages and Bollinger Bands, respectively. In the first one, a buy trade is placed if the closing point of the price exceeds the moving average and the first moving average has a higher value than the second one.
As we know, for the Bollinger Bands scheme, trades are placed if the closing point lies below the lower BB or above the upper BB. This scheme is based on the theory that when the MA with a period of more than ten days intersects the upper BB with a period of 44 days, it indicates an uptrend.
As a general rule, the take profit target is placed at a distance equivalent to 15% of the opening price, while the stop loss is placed at 10%.
Keltner Squeeze

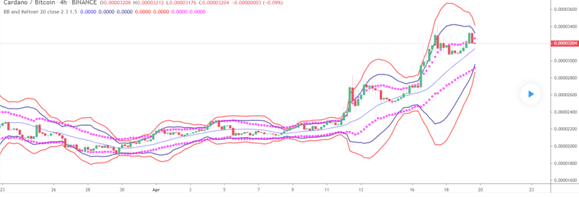
This scheme involves the Cardano/Bitcoin pair being traded using Bollinger Bands used in combination with Keltner Channels. If you are looking to identify a breakout, you should look out for the red and blue lines creeping within the Keltner Channels. The direction of the breakout could be upward or downward.
The distance of the price from the blue band is two standard deviations, while for the red band, it is three standard deviations. In case the price rebounds from the red line, a minor retracement will occur, provided there is no huge breakout. Narrowing bands indicate a period of consolidation, followed by a probable upward or downward movement.
Stochastic Bollinger

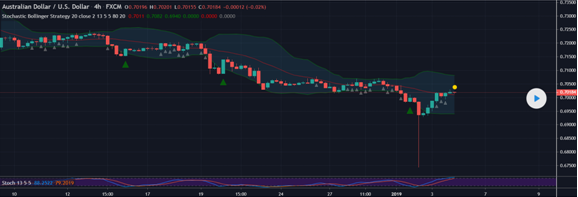
This strategy combines the Stochastic and Bollinger Band indicators for the AUD/USD pair. Here, you should place a buy trade (indicated by the green triangle) upon the formation of a bullish candlestick. The other conditions are that the opening point of the candle lies at a point that’s below the lower BB and the value of the Stochastic indicator is less than 20.
A good indication of a sell signal is when a bearish candlestick forms and its opening point exceeds the upper BB. Also, the Stochastic should be more than 80.
Summing up
The similarities between the above-mentioned chart situations are as follows:
- They can be used for identifying oversold and overbought zones.
- They help you identify consolidation zones that are followed by large price shifts.
- You can judge the strength of the trend using them.
- By altering the standard deviations, you are able to get wider bands that allow for the capturing of more price action.
- They often display fake breakouts.


