Although the Commodity Channel Index indicator is most effective when used as a filter, traders also use it to generate reliable signals that allow them to make their entries. The general strategy is to keep an eye out for the CCI movement above the +100 mark, which indicates a buy trade. Movements beneath -100, on the other hand, give you an indication of a sell signal.
Normally, traders only consider the buy signals for entries and make their exits when the short trade signals appear. Upon the reoccurrence of the buy signal, they might choose to re-invest. Commodity Channel Index can also be used alongside oversold/overbought regions and convergence/divergence indicators. To know more, take a look at the charts below.
- MS CCI Squeeze
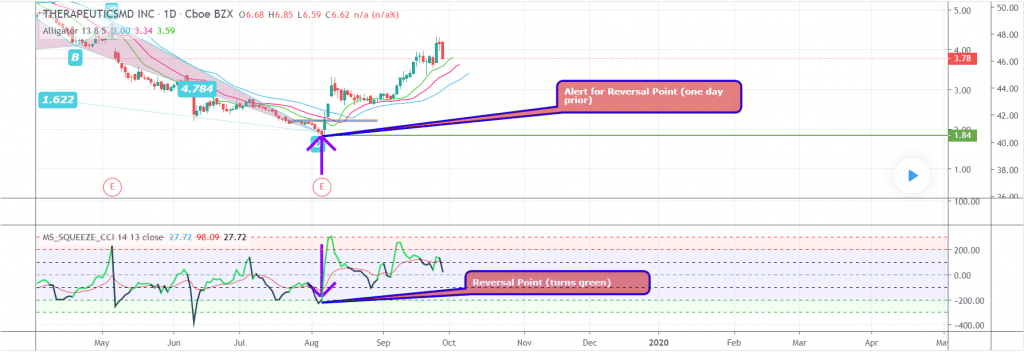
Here, the moving average of the Commodity Channel Index is taken in conditions that are specific to volatility. In the region shaded green, CCI calculates oversold, while in the one shaded red, it calculates overbought. You can see the arrows pointing out the reversal points, i.e., the points after which the trend changes its direction, thus opening up trading opportunities.
But, you should remember that the green and red shaded areas do not represent only buy and sell signals. This scheme is most effective when the market conditions are favorable and when the trader has gotten an indication of the reversal scenarios aligning. You should look out for downtrending and uptrending head and shoulders patterns and harmonic patterns while working with this indicator since they might reveal occasions for a breakout.
- RSI CCI EMA
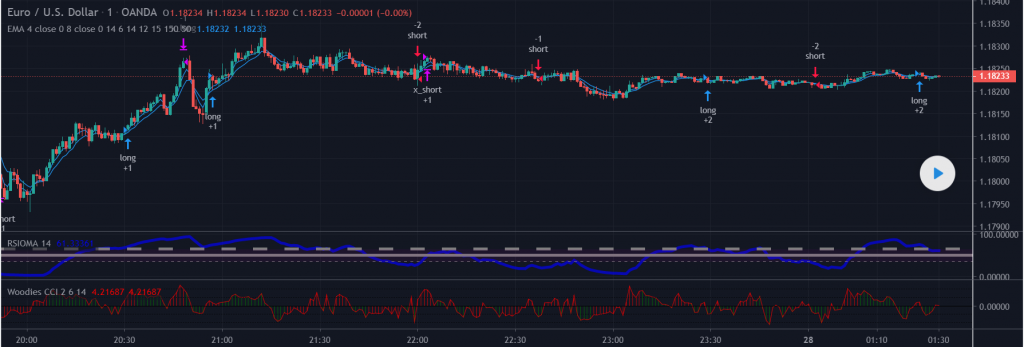
This is a strategy for a day trade chart that is based on the EUR/USD pair. It consists of 4-period and 8-period Exponential Moving Averages that help you investigate the chart for crosses, Relative Strength Index levels for identifying oversold and overbought regions, and Commodity Channel Index levels.
For making trade entries, you first need to confirm that the 4-period Exponential Moving Average has crossed the 8-period Exponential Moving Average. The second confirmation is made by monitoring the RSI level, and the final one arrives with the Commodity Channel Index level.
When all three indicators give you the confirmation, you can safely enter the trade. For making your exits, you ought to use a fixed pip points scheme for Take Profit and Stop Loss.
- 2CCI and RSI
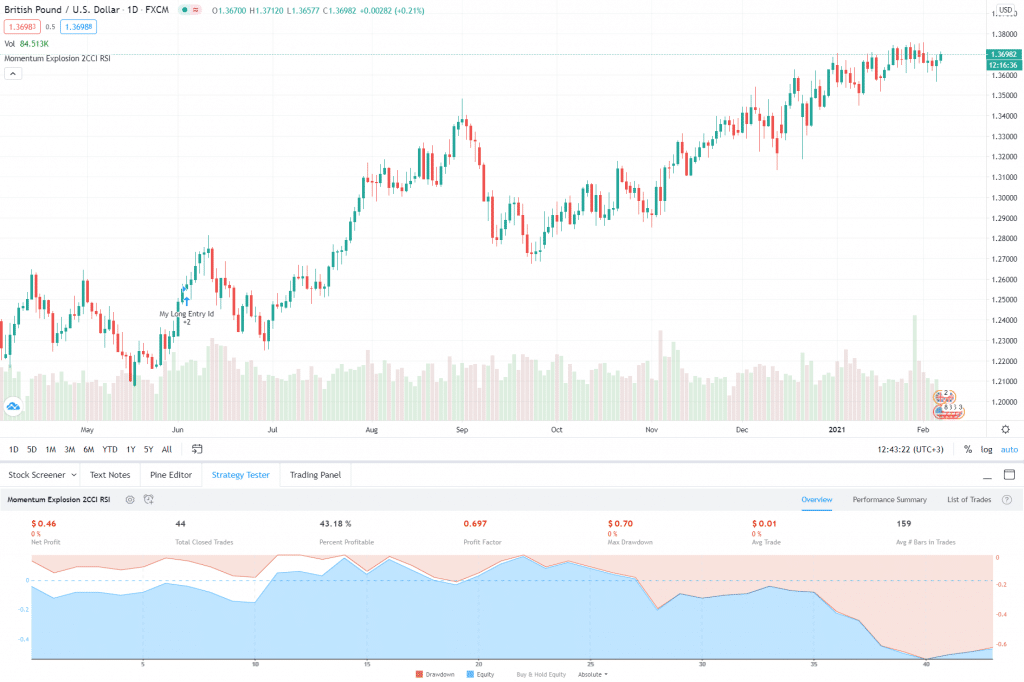
This trading chart is based on 2 Commodity Channel Index, 2 Moving Averages, and Relative Strength Index and concerns the GBP/USD pair. The CCIs and Relative Strength Index can confirm the moving average cross, which in turn generates the trading signals.
Here, the dual CCI and RSI filter the 2 Moving Averages. A buy trade is placed based on four distinct conditions. The first one is the 8-period Exponential Moving Average exceeds the 26-period Simple Moving Average and moves upward. Secondly, both the Commodity Channel Index for 34 periods and 55 periods must be more than 0.
The final buy condition is that the RSI 26 must exceed 48. Conversely, a sell signal is generated when the 8-period Exponential Moving Average crosses the 26-period Simple Moving Average and advances downward, the 34- and 55-period CCIs exceed 0, and the RSI 26 is less than 48.
- MACD and CCI
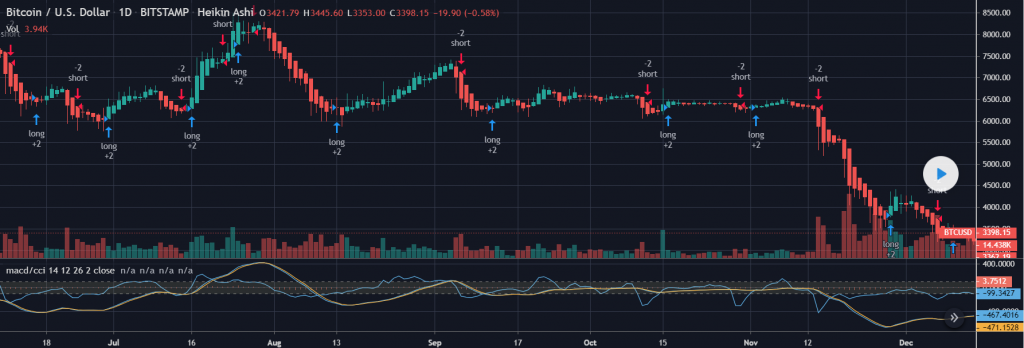
This trading scheme involves the Bitcoin/USD pair, the Moving Average Convergence Divergence Indicator with periods of 2, 16, and 12, and a Commodity Channel Index with a period of 14. The timeframe for this trading situation is four hours.
A long position should be opened when the signal from the CCI intersecting the level line advances upward, and the Moving Average Convergence Divergence +100 operates above the 0 line. The position should be closed when the CCI returns to level line +100.
Sell trades should be opened at the moment when the signal is more than the Commodity Channel Index down the line – 100. You should close the position once the Commodity Channel Index signal touches the back line -100.
- 123 Reversal and CCI
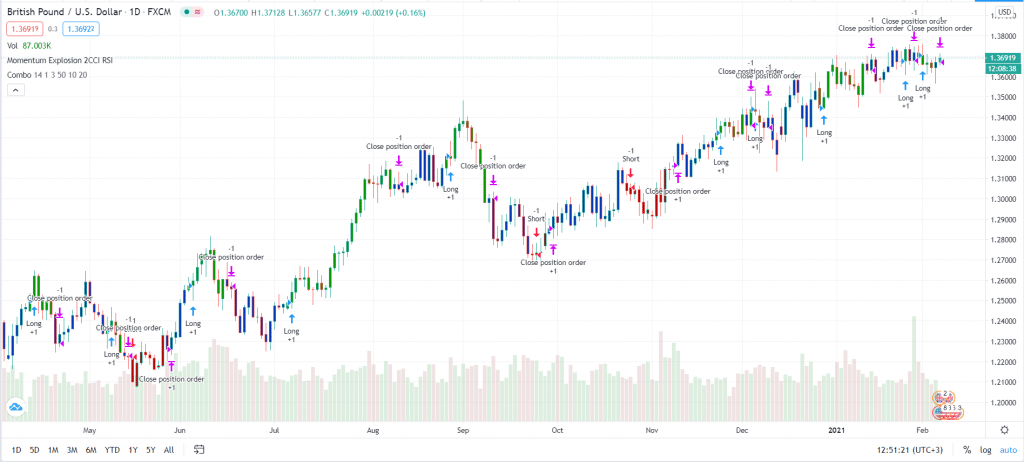
This is a combination of two strategies that will help you generate a cumulative signal. In the first scheme, you place a buy trade if the closing price lies at a point higher than the previous closing point during a period of 2 days and if the value of the 9-period Stochastic Slow Oscillator is less than 50.
A short trade is placed if the closing price lies at a lower point compared to the previous closing price for a 2-day period and if the value of the 9-day Stochastic Fast oscillator is more than 50. In the second scheme, the Commodity Channel Index is used to determine how the asset is faring compared to the average price.
Thus, when Commodity Channel Index has a high value, it indicates that the prices are much higher than the mean price, whereas a low CCI indicates that the prices are lower in comparison to the mean price. Normally, the value of CCI oscillates between -100 and +100.
Summing up
The similarities between the chart situations are as follows:
- They give you an indication of when the trend is about to reverse after a period of bearish or bullish movement.
- The current price is compared to the mean price for a certain time period.
- If the conditions turn turbulent, all of them can generate false signals, even signals that will cause you to lose trades.
- They can be used for multiple timeframes in order to denote dominant trends.
- You can use them on short-term charts in order to isolate pullbacks.
- By studying the charts, you get an idea about whether the asset is oversold or overbought.


