
If you are searching for a trading scheme that lets you predict a trend and open a trade at the ideal moment, engulfing candles are perfect for you. Several players in the Forex market prefer candlestick patterns since they are easy to interpret and furnish accurate predictions. Here, we shall discuss engulfing candle patterns and how you can formulate the Forex trading strategies using them.

What is an engulfing candle pattern?
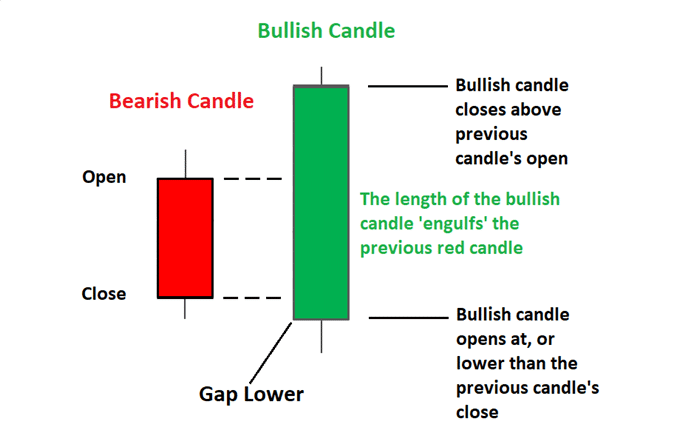
This pattern comprises two candles that signify two different phases. A highly recognizable pattern, it comprises of one inundating the other. In fact, in order for the engulfing pattern to be legitimate, you ought to be able to fit one candle inside the other, as depicted in the figure shown above.
Observe how the bullish candle engulfs the bearish candle in its entirety. Of course, the converse is feasible as well. The bearish candle could have a longer length, thus inundating the bullish candle. The candlestick body represents a particular trading phase range, and it depends on what settings you choose for your charts.
If you wish to compare the market shifts between different periods, you can place the two bars side by side. While a green candle represents a bullish movement, a red candle depicts a bearish trend. In this regard, you should remember that this is a lagging indicator, which means the price action precedes them since before generating the signal, they need the data presented by the last two candlesticks.
Bullish engulfing candles
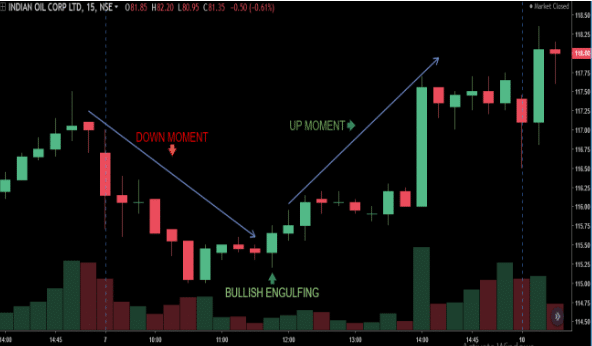
Bullish candles are the strongest when they occur at the trough of a bearish trend, thus designating a rise in the buying demand. This pattern routinely sets off a trend reversal as the prices are driven further upwards by the new buyers entering the fray. Here, the green candle totally engulfs the preceding red candle.
The appearance of a bullish pattern compels the price action to show a definite bearish trend. It provides the initial push needed for consistent upward movement. The trend can be confirmed with the help of the price action and oscillators.
Bearish engulfing candles
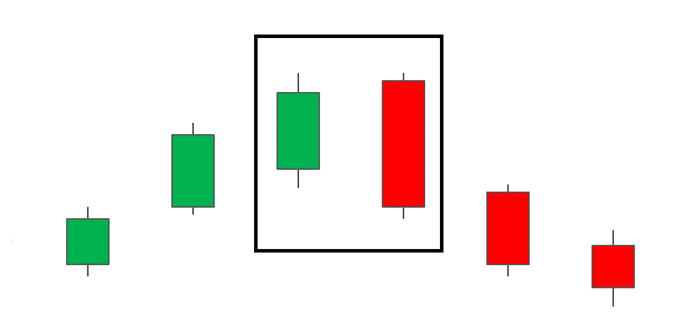
Bearish candles are at their strongest when they appear at the uptrend’s peak and signal the rising pressure on traders to sell their currencies. This pattern frequently activates a trend reversal with the prices being driven downward by the increasing number of sellers making their entries. Here, the red candle must totally cover the preceding green candle.
The occurrence of this pattern causes the price action to display a bullish movement. The larger red candle tells us that the vendors are entering the market in hordes, which gives the market the push needed to drive the momentum further.
Trading Strategy
Trading strategies result from a multitude of factors; thus, there are various engulfing candle trading procedures for forex. Let us look at the most common ones.
Trend Isolation
In order for a day trader to apply this pattern as a part of their plan, they have to figure out the general direction in which the trend is heading. You should ideally place your trades in the same direction.
When both the peaks and troughs of the price show higher levels, the situation is described as a bullish trend, the price advances for some time, pulls back and advances again after a while. The advancing price waves are much bigger than the pullbacks, which implies that the general movement is bullish.
When the trend is bullish, it is wise to open long trades and buy the currencies with the objective of selling them in the future for a profit.
When both the troughs and peaks of the price show lower levels, the scenario is termed as a bearish trend, here, the higher pullbacks are small in comparison to the falling waves, thus making the price advance in a generally downward direction. In this case, short positions are ideal.
Upward/Downward Pullback
After you have confirmed the trend, you should stand by for a pullback. You ought not to apply this scheme if the trend is ambiguous or if its existence is questionable. When you stand by for the pullback to happen, you will get more favorable prices when the ensuing wave appears.
And, when the trend is bearish, you should keep an eye out for a high pullback, making sure it does not exceed the previous pullback since this breaks the given trend. Conversely, you should monitor the bearish pullback in a bullish trend, making sure it does not fall below the previous pullback trough since the uptrend is violated in this case.
In order for a price correction to take place, there must be two price shifts in the pullback. It is not necessary for a pullback to advance in the reverse direction of the trend. Sideways pullbacks are just as common.
Entering Trade
You can open a new trade after confirming the pattern. This happens when the candle following the engulfing one breaks the latter’s body and causes it to advance in the forecasted direction. You can enter a trade when the closure of a candle occurs past this point.
Exiting Trade
You should remember that this strategy does not present a definite exit since trends can continue for a long period of slump swiftly. You should exit the trade when the trend connotes a reversal. This occurs when both the highs and lows are higher during a bearish trend or lower for a bullish trend.
Conclusion
Thus, we came to know about the engulfing candle pattern and what it signifies for the Forex trader. In order to enhance the accuracy of this scheme, you can use it alongside resistance and support schemes. For a novice Forex trader, this is an efficacious tool as it gives them a clear reason to place their trades.

