Know the Basics
It is essential that you research, study, and understand different approaches if you want to adopt and incorporate the ones useful for you. One of the important patterns for trading is the slingshot reversal pattern, also known as the false break and reverse pattern. A slingshot reversal takes place when a major support or resistance level temporarily breaks but then fails to hold. To put it simply, the markets take out important support and resistance but fail to follow it through after that. Instead, it runs out of momentum, causing it to reverse back into the old range. The key to slingshot reversal is that it should happen around a level of extremely high importance.
Now, what does high importance mean? It means that many people keep watching the level and it is likely to cluster orders around it. When you enter the markets at the beginning of the day and prepare to trade, you need to notice if everyone is talking about a certain support or resistance level. You have to keep that level in mind for a potential slingshot reversal.
Slingshot Reversal Pattern
The slingshot reversal pattern is effective as when a major support level breaks; it encourages shorts to add and triggers capitulation by longs. Moreover, it brings in breakout sellers like models, trend followers, and sellers from other time frames that may have missed out and need to capitulate at lower levels. After that, if price reverses and recaptures the broken support, the market is caught offside suddenly. At this time, selling is exhausted, stop loss orders are filled and the market is max short. You can suddenly notice the potential for an extremely aggressive short squeeze and high energy upside continuation. Take a look at the example below.
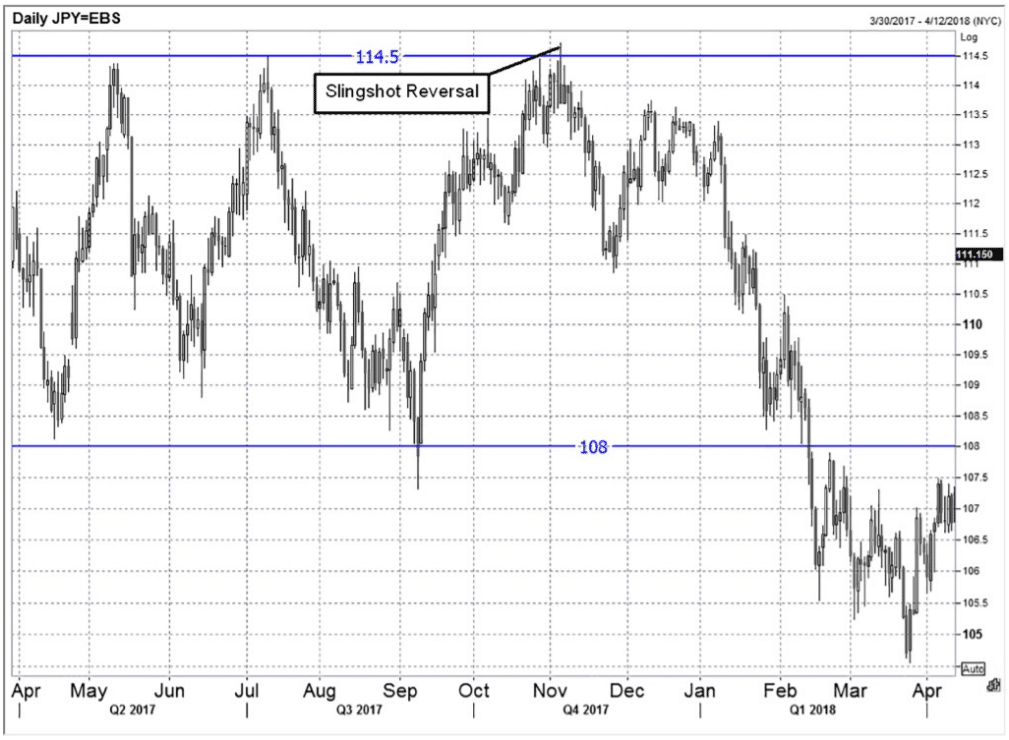
USDJPY traded in the 108.00 / 114.50 range from April to early November 2017, in spite of raging optimism in US equities on the back of US corporate tax reform. What the market expected was a topside breakout in USDJPY. In the first week of November, the pair rallied up close to 114.50.
When USDJPUY shorts, the range traders left stop loss orders that were above 114.50. At the same time, longs were aggressive to add on the break. Real money hedgers and corporates that had the natural need to purchase USDJPY looked on nervously. The pair rallied up and aggressively spiked through 114.50 and touched a high of 114.73. Then it reversed back quickly below 114.50. You can observe the movement in the chart below.
In the chart, we can mark the daily USDJPY with a slingshot reversal from March 27 to April 2018.
It may look like a blip on the daily chart but you need to know that massive volumes transacted above 114.50 on that day. Longs added, shorts stopped out, and those in need of USDJPY bought. However, by the end of the day, the buying was exhausted. The market closed well below 114.50.
You can notice that USDJPY never looked back after closing back the important 114.50 support below. It did not fall back to the old range bottom for a few months, let alone going through it. The pattern was a brilliant reversal indicator.
How To Trade The Slingshot Reversal?
It is simple to trade the slingshot reversal.
You may follow these steps –
- First, you have to identify a vital level that everyone is watching. It is essential to choose the level that most observers are signalling out. Keep in mind that the more people talk about a level, the better it will work as a slingshot reversal candidate. We will discuss the strategy using a resistance level here and you need to flip everything around for a support level.
- You have to wait until the resistance level breaks. When it does, you can put a stop entry order 10 basis points below the key level. Keep in mind that 10 basis points are 0.10%. If you want to wait for 114.50 to break, then you can get short by inserting a stop entry if USDJPY is trading at 114.39.
- When the stop sell order triggers, you can place a new stop loss on the short position 10 basis points above the new high. This is going to be your exit point where you can cut your losses. The reason behind is that the slingshot reversal will be invalid and the idea will be wrong it USDJPY makes a new high. In that case, you need to take 114.73 high and add 10 pips of leeway to keep the stop loss on the short position at 114.83.
- After that, look for a reasonable take profit. On a trade like this, 1.5X or 2X average daily range is usually a reasonable target. You can see a double bottom around 111.50/70 in this case. So, you can put your take profit at 111.76 which is just above the double bottom. Regardless of whatever reasonable take profit you pick, it is likely to trigger within a few weeks.
In the example above, the USDJPY market was the victim of a false break of 114.50 in November 2017. The slingshot reversal is a logical and common pattern. You can explain it by positioning and psychology. The pattern also allows a tight stop which also allows significant leverage. You have to keep an eye out for slingshot reversals and trade them aggressively.


