Because of its unique position within the world’s economic and political institutions, the gold market has a lot of liquidity and potential to profit in almost any situation, whether it’s bullish or bearish. While many people prefer to own gold outright, futures, equities, and options markets offer incredible leverage at a low-risk level.
Trading gold is not difficult to learn, but it does necessitate skill sets specific to this commodity.
How does the gold price move?
Gold, as one of the world’s oldest currencies, has become deeply imprinted in the awareness of the financial world. Even though almost everyone has an opinion on gold, the yellow metal responds to only a few price triggers. Greed and fear, inflation and deflation, and supply and demand are polarized forces affecting mood, volume, and trend intensity.
Market participants who trade gold in response to one of these polarities run a higher risk than those who trade gold in response to the other. Consider a scenario in which global financial markets are on the decline and gold is on the rise.
Many traders believe that fear is driving the price of gold up and enter the market in the hopes of profiting from the emotional crowd. On the other hand, inflation may have spurred the stocks’ decline, attracting a more technical crowd willing to sell against the gold rally aggressively.
These forces are always at work in foreign markets, generating long-term themes that track uptrends and downtrends.
For example, because market players were focused on excessive fear during the 2008 financial crisis, the Federal Reserve’s (FOMC) economic stimulus program, which began in 2008, initially had little impact on gold. Quantitative easing, on the other hand, aided deflation, paving the way for a significant reversal in the gold market and other commodities.
Comparison of trading gold and forex
Because gold is not subject to the whims of governments and central banks, it has long been regarded as a store of value. Gold prices are usually unaffected by fiscal or monetary policies and should always be worth something — unlike a currency, which might become nearly worthless due to rapid inflation.
Gold as a safe haven
When traders are concerned about financial risks, they may purchase safe-haven assets. On the other hand, traders tend to sell safe-haven assets when their risk appetite rises, choosing equities and higher-yielding currencies instead.
As a result, if you’re trading gold, you’ll need to keep an eye on the US dollar’s moves. For example, if the value of the US Dollar rises, the price of gold may fall.
Market liquidity
Other than EURUSD, USDJPY, and GBPUSD, the World Gold Council estimates that gold has higher average daily trading volumes than any other currency pair. Because the daily trading volume of gold is bigger than that of EURJPY, the spreads are small, making gold comparatively cheap to trade.
The long term look at the gold chart
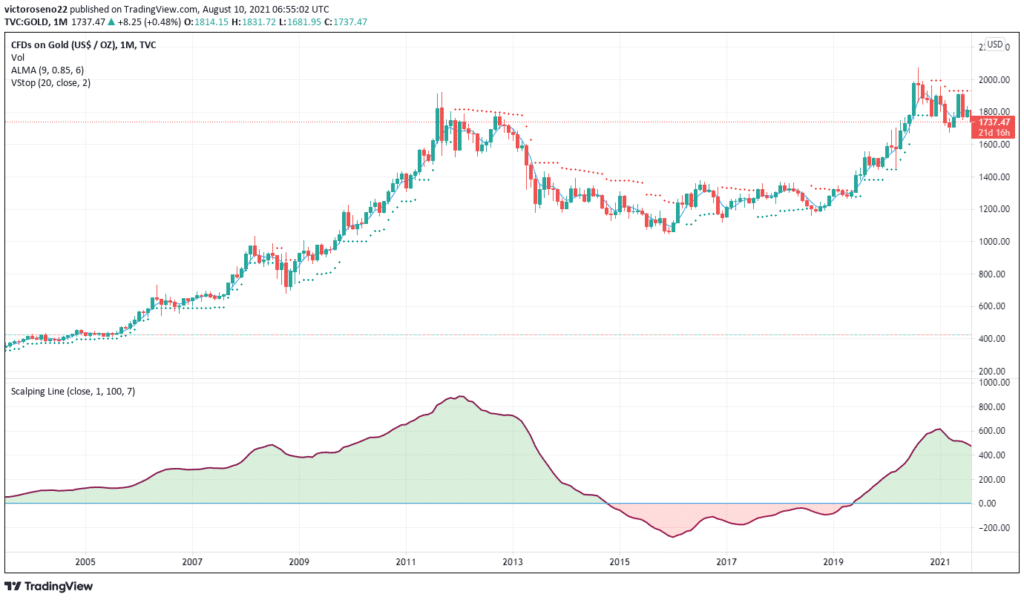
Take the time to get to know the gold chart, beginning with a long-term history of at least 100 years. Gold has not only carved out decades-long trends, but it has also been trending lower for very extended periods, depriving gold bugs of profits. This study highlights price levels that should be monitored if and when the yellow metal reappears to test them strategically.
Gold’s recent history showed minimal fluctuation until the 1970s when it took off in a long upswing after the dollar’s gold standard was abolished, fueled by soaring inflation as a result of ballooning crude oil prices. Following a high of $2,076 per ounce in February 1980, it fell to around $700 in the mid-1980s due to the Federal Reserve’s tightening monetary policies.
The subsequent slump lasted until the late 1990s, when gold began a historic rise that peaked at a high of $1,916 per ounce in February 2012.
Although it soared 17 percent in the first quarter of 2016, showing the highest quarterly increase in three decades, it’s now trading at $1,635 per ounce as of March 2020, after a gradual decrease of roughly 700 points in four years.
Select a location
Liquidity follows gold movements, rising when the metal moves rapidly higher or lower and falling when the metal is generally calm. Due to lower average participation rates, this oscillation affects futures markets more than equities markets. New products introduced by Chicago’s CME Group in recent years haven’t changed this equation significantly.
Technical analysis of gold
Technical traders will observe how the gold market state has altered over time. From 2005 to 2015, gold prices had a significant uptrend. Gold prices have been trading in a narrow range since 2015, fluctuating between $1,000 and $1,400 per ounce.
Traders may use a momentum strategy if the market is trending and use a low volatility or range strategy if the gold is range-bound. This is a crucial component of any gold trading strategy.

For those who prefer technical analysis, using prior highs and lows, trendlines, and chart patterns is the easiest method to get started. When the gold price is increasing, a substantial past high above the current level and a previous critical low when the price is falling will be apparent targets.
Conclusion
First, you should understand how three polarities influence the vast majority of gold buying and selling decisions.
Second, get to know the many groups of market participants that focus on gold trading, hedging, and ownership.
Third, spend some time studying the long and short-term gold charts, keeping an eye out for critical price levels that may emerge.


