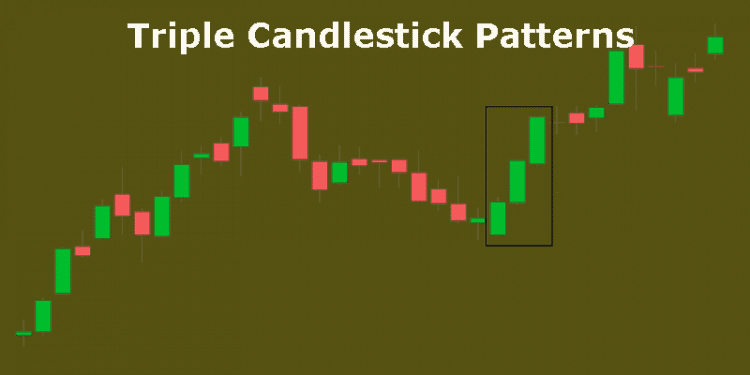
What are Triple Candlestick Patterns?
Japanese candlestick patterns have been widely used to forecast price direction – especially since the patterns are quite versatile and easy to spot. Detecting specific formations in these candlesticks can guide you towards better understanding of price action and market behaviour. Incorporating the analysis through triple candlestick patterns in your long/short-side trading strategies will help you make more informed trading decisions.
Candlestick patterns pack a punch in terms of information in simple price bars. The triple candlestick patterns are sensitive to time in the following ways – They are reliable only within the limit of the duration when the chart is analyzed – this can be daily, weekly or monthly. Secondly, their strength declines quickly 3-5 bars post the completion of the pattern.
Different candlestick patterns depict different trends in momentum and price direction of the market.
Triple candlestick patterns show either –
- A Reversal – the end of the prevailing trend and change in direction of price movement
- Or a Continuation – the stretching of the existing trend, i.e. continuation in current direction of price movement
The four most commonly used triple candlestick patterns are introduced below –
Morning Star
A bottom reversal pattern, the Morning Star is usually found at the conclusion of a trend. Just as the morning star in the east precedes sunrise, this pattern is considered to precede rising prices, occurring when the market is in an existing downtrend.
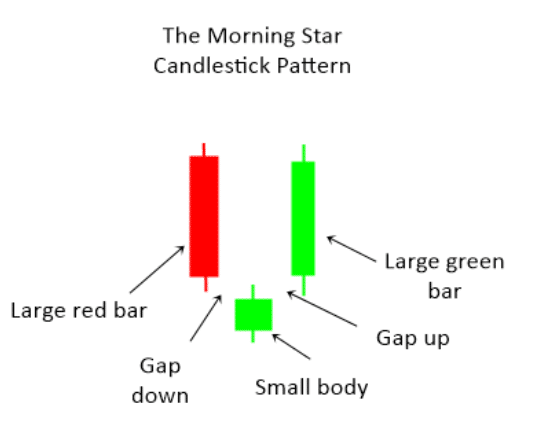
The pattern begins with a long red candle which is followed by a candle with a smaller, flatter body that was open with a gap down, lower than the preceding candle. These two are followed by a green candle the body of which penetrates back up deep into the body of the first candle. The colour of the candle in the middle is of no consequence – it can be either green or red. This pattern signifies that the market is in the clutches of bearish forces. However, the bearish forces aren’t strong enough to force the market lower than where it was and they have successfully gapped the market. The third green candle confirms the failure of the bearish forces to push the market lower and a switch of control in the hands of bullish forces – signalling a strong bullish reversal on the cards.
Evening Star
In direct contrast to the morning star, the evening star pattern depicts a reversal in the market from bullish to bearish forces.
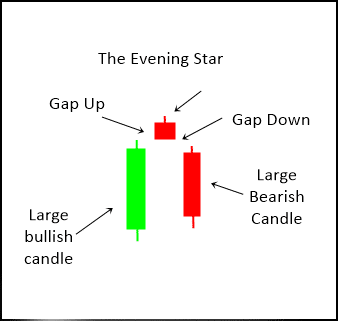
As the evening star just appears in the sky just before evening falls, this pattern alerts a fall in prices. The first candle is a tall green one which shows an uptrend in effect, followed by a small, flat candle, the colour of which is unimportant. The gap between the body of this small candle and the preceding candle is important. The second candle provides a warning of a possible top forming and the pattern is completed with a confirmation of a bearish reversal in the form of a long red candle, the body of which penetrates deep into the body of the initial green candle. This provides further evidence that we may have a top.
Three White Soldiers
This pattern signals the continuation of a trend with the three white advancing soldiers showing a steady increase in price. Usually occurring during a downtrend, the three green candles in a row depict increasingly higher prices and is considered a bullish sign, especially when it occurs after a period of sideways ranging.
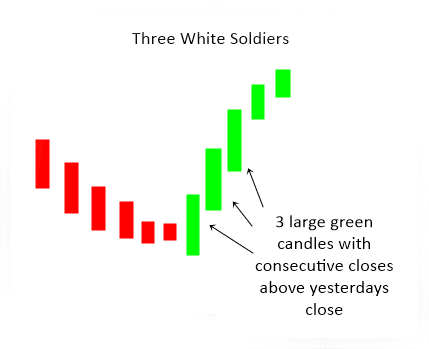
Ideally, you would want to have the openings, i.e. the bottom, of each candle to lie within the body of the preceding candle; or at least lie in close proximity to the body of the preceding candle. The closes should also be at or close to the high of the session – look for very small to no upper wicks. Moreover, pay attention to the size of the body of the candles – they should not be gradually shrinking. When all three candlesticks appear as per the pattern, this can confirm the end of a downward trend and can be viewed as a healthy way for the market to be increasing in price – such that it ensures sustainable gains.
Three Black Crows
The three black crows pattern is represented by three declining red candles and indicates a topping out pattern in the market. The pattern crops up during an uptrend and signals the onset of a bearish trend in the market.
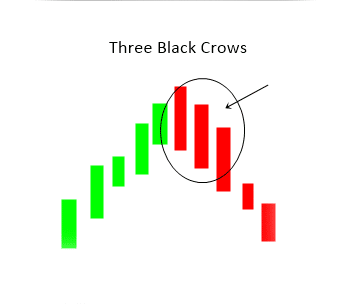
The candles in this pattern should be long bearish candlesticks that begin in close proximity to the high end of an uptrend, with the bottoms closer to the lower wick mark closing near the low of the day. The opening of each subsequent candle is higher than the previous close and the prices gradually close at lower levels. This pattern indicates that the declining market trend will continue to even lower lows, with a potential for an even wide-spread downward trend. This begets fear among the bulls and the prices should cross below the level at which the third candle closes to generate a sell signal.
Final Word
The popularity of candlestick patterns has risen in the last few decades. Traders across the board have used these patterns to predict price movement. However, in recent times, experts have argued against the reliability or validity of information provided by the candlesticks. The current day reality of modern electronics has put a huge question mark on the validity of reversal and continuation signals given by the candlesticks. Algorithms used especially by hedge fund managers trick investors looking for extreme bullish or bearish trends. However, these patterns still persist as crowd favourites, especially since research has shown sufficient precision in the projection of price action by a narrow selection of the patterns.You will need a brokerage account to make use of these patterns to make investment decisions on a regular basis – choose a broker as per your investment needs and trading style.

