Analyzing charts requires the assessment of Moving Averages (MA). Many traders utilize them to assess the market direction, while many others incorporate superior strategies for trading. One of them is the Bladerunner strategy that is based on the 20-period exponential moving average (EMA from here onwards). This strategy сan partly be incorporated into any time-frame and currency pair. Let’s take a look at what it constitutes and how to utilize it in Forex.
What is the Bladerunner Forex trading strategy?
This strategy is utilized to determine the ideal level for entering/exiting a trade. It is used to speculate on rising prices by going long or falling prices by going short. Which position you take depends on whether you receive a bullish or bearish signal from this strategy.
Since this strategy depends on the EMA, it doesn’t have to use any additional indicators. One thing to be mindful of is that one has to be aware of the concept of support and resistance levels and how they equate to the likely price movements in the future.
Additionally, one has to be aware of whether the session has closed under or above the EMA. A bearish reversal is on the cards if a pre-existing bullish trend has closed under the EMA; conversely, a potential bullish reversal is cued by the closing of a bearish trend above the EMA.
Having the right management strategies, such as placing stops and limits, will prevent one from being caught in uncharted territory if such reversals take place. For long positions, place a stop to avoid incurring significant losses if the trends turn bearish, a limit for long positions when the trends turn bullish.
Criteria to use the Bladerunner strategy
There are a couple of criteria that must be satisfied for this strategy to work. These are as follows:
- Ensure that the price has broken out of range or is already in a strong trend.
- Once the above criterion is met, make sure that the price has retested the EMA. If the trend is above the EMA, the test must indicate that the price has dropped to the level of the EMA and reversed to the main trend. If it closes above the EMA, it is a clue that the upward trend is still in motion and is quite intact. The converse is true for the downtrend too.
These two criteria are crucial if one is going to start placing orders with this strategy.
How to trade using the Bladerunner strategy
There are numerous methods by which one can trade with this strategy since the idea behind it stays the same. Amateur traders will rely mainly on the EMA, but experienced ones tend to mix this concept with their own analyses before placing their orders. Below are a couple of strategies for traders of all breeds.
Buy example
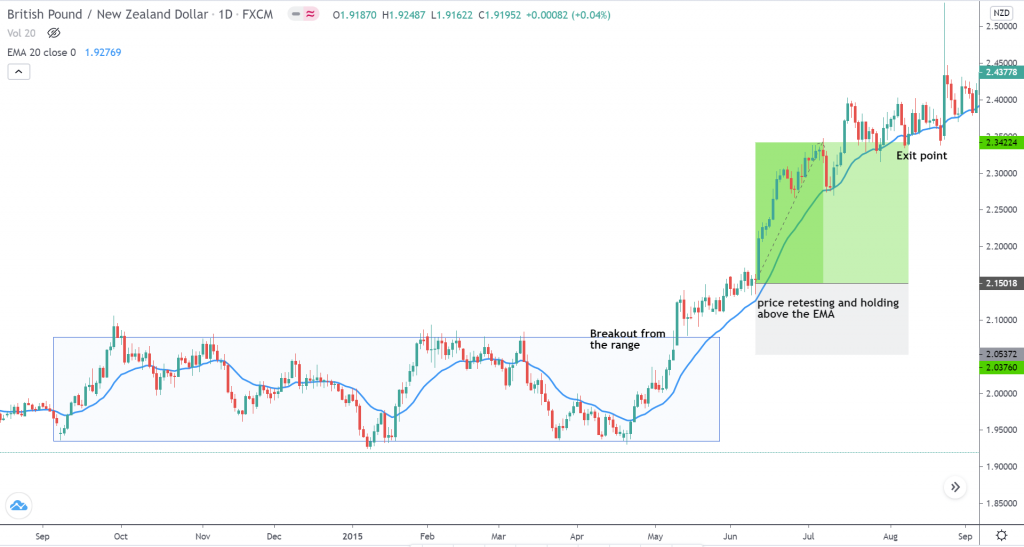
Here is the daily time-framed chart of GBP/NZD with the EMA.

Initially, the price action had been ranging and moving sideways. But, around the middle of May, it broke away and started trending. Do note that the breakout occurred well north of the EMA point. Starting in June, it reverted to the EMA, indicating that the trend is rearing to move back up north. A trader would want to go long as long as it is at least two candles above the EMA.
The stop-loss can be set a few pips under the top of the range, ensuring all the while that it is still below the EMA. There isn’t any specific take-profit placement point in this strategy. But, one would want to close out the trade once the price dips below the EMA.
Sell example
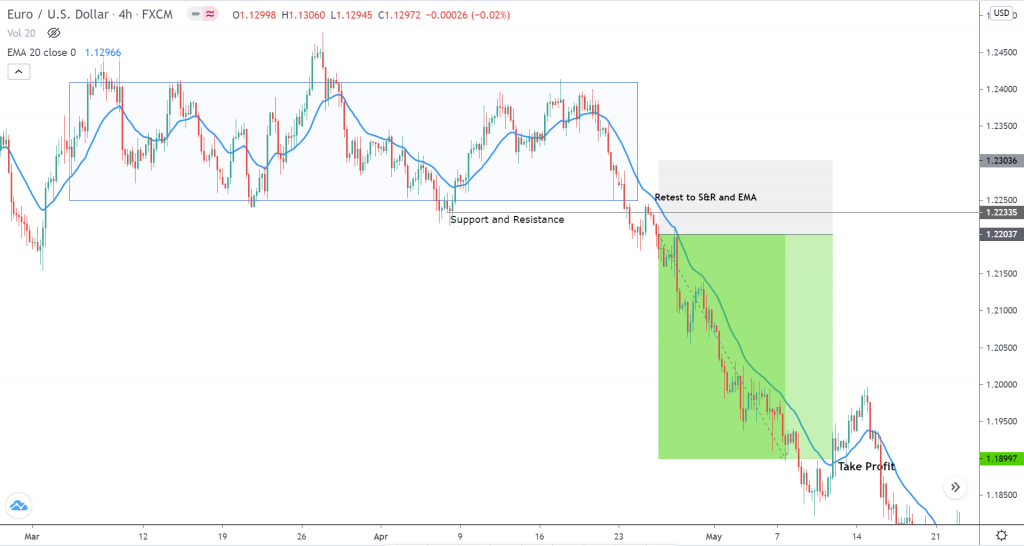
Here is the price chart for EUR/USD on the time-frame of 4 hours.

Again, as can be seen from the initial price movement, the market was ranging but broke away downward later on. Upon breaking out, it reverted and tested the EMA and S&R levels. Thereafter, it went down again, cueing clearly that the downward trend will continue. One would do good to start going short at such levels.
The stop-loss ought to be positioned at the bottom of the range, ensuring all the while that it is still above the S&R level. For the take-profit point, there is no reference in this strategy. But, traders tend to close out their trades once the markets move beyond the EMA.
The Bladerunner reversal strategy
This is another strategy that traders should be aware of. It is grounded on the polarity indicator, combining both the EMA and Bollinger mid-bands.
With this strategy, traders should be keeping their eyes peeled for prices that break out with some strength, stall, and reverse through the polarity indicator. It should return for retests from the opposite direction.
This is not too different from its parent strategy since both of them trade in the trend direction. One can determine if the price closes to the right of the polarity indicator. The Bladerunner strategy waits to confirm a trending pattern and only then moves in the polarity indicator’s direction. However, the reversal takes action as soon as the trend completes, and the action closes on the right side of the polarity indicator.
To sum up
This strategy eliminates a variety of subjective factors and basically depends only on the price action, which greatly simplifies trading. It combines the EMA with S&R levels, with the former acting as support in a bullish trend and resistance in a bearish trend.
A bearish reversal is on the cards if the session closes under the EMA of support during a pre-existing bullish trend. Conversely, if it closes above the EMA of resistance during a pre-existing bearish trend, a bullish reversal is cued.


