When you’ve just begun your journey in the Forex market, it may feel like the game is all about the price of the pairs. But in reality, it is not quite so. Yes, price is definitely a crucial factor, but if you wish to make it big, there are plenty of other things you need to know about. For instance, you ought to take into account whether your trading technique is ideal for the pair you’re dealing in.
What is volatility?
Volatility is a vital factor to learn about while operating in the Forex market. It is nothing but price divergence expressed in a quantitative fashion. Thus, volatility is a representation of how fast or how slow the prices shift due to a number of influencing factors.
Thus, when a market is said to be highly volatile, it means the price wavers there at a lightning-fast speed. On the other hand, a market with low volatility is one where the price oscillates at a modest rate. That being said, this is not a factor that remains constant, and often a highly volatile market can turn stable in no time.
Volatility types

Volatility is interpreted in various ways by various individuals. They are as follows:
- Historical volatility. This value is computed from real price shifts in the past and is thus based on what is already known.
- Implied Volatility. It can be defined as the predicted rate of price deviation in the future for a fixed time span. Trader sentiment is represented through implied volatility, so it is governed by traders’ emotions such as fear and complacency.
What’s the importance of a volatility indicator?

For every Forex merchant, it is vital to keep an eye on the volatility levels since certain trading schemes and styles are more suitable for certain volatility levels. For instance, an individual might want to earn profits without risking a sizable chunk of their balance, in which case they should select a pair with a relatively low volatility level.
Conversely, a person who wants to win big while taking substantial risks is better off choosing a pair that has high volatility. Since such a pair is characterized by wide price deviations, they stand to win huge profits from their trades. Your trading scheme should be optimized based on the fickleness of pairs, including the trading time frames during which this parameter undergoes wide deviations for some currency pairs.
Historical volatility
When you hear people mention volatility, the chances are high that historical volatility is what is being referred to. From this parameter, you can know the price shifts that had occurred in the market from year to year. There are various factors you need to define before you start computing historical volatility.
Firstly, the time span for which the price deviation is being calculated should be decided. You need to examine the variation in the worth of currency pairs. Normally, people calculate this on a daily, weekly, or monthly basis.
The number of periods used in the computation also needs to be determined. This can be achieved quite easily with a calculator or an excel sheet. Although it is not often used for assessing the likelihood of a loss, it can deliver a sign of the same.
Traders might use this parameter to figure out the deviation of a pair’s worth from its mean price. In trending markets, historical volatility gives you an idea of the distance by which the price has shifted from the average. If the trending market is characterized by high stability, however, it is natural that the volatility will be lower.
How to measure volatility?

Here are some of the ways you can measure this factor:
- Average True Range (ATR)
This particular indicator normally computes a session’s range in terms of pips, finally establishing its average for a fixed number of sessions. For instance, if you select an ATR of 10, you would get the mean trading range for the preceding ten days. Thus, the current volatility level for a specific pair can be obtained with the help of ATR.
If you see the value of ATR decreasing, it means the pair’s volatility level is going down, and when it’s increasing, it signals a growing volatility level. It should be noted that you cannot possibly draw a conclusion on the price trend’s direction using the ATR indicator.
- Bollinger Bands
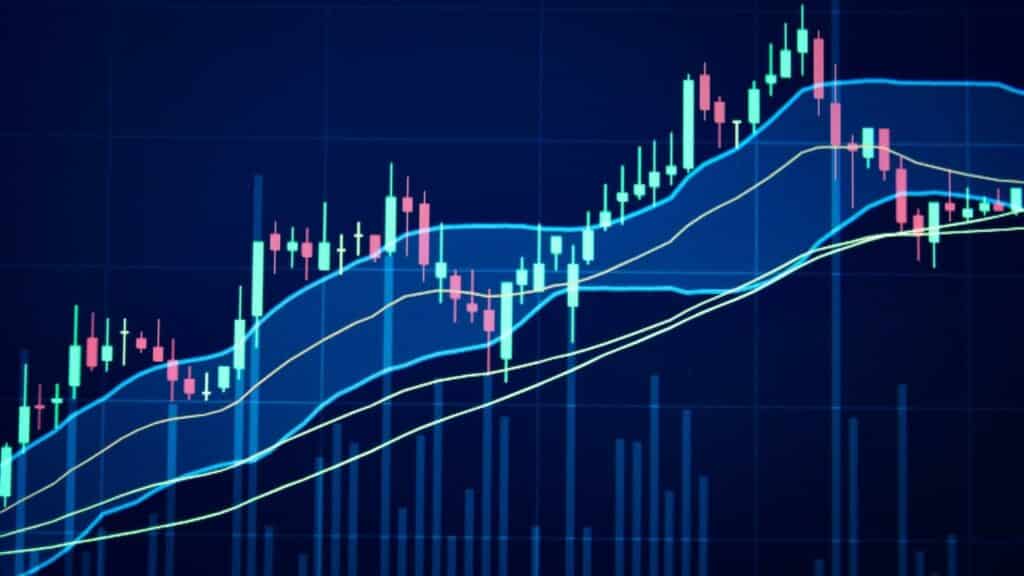
Many traders rely on Bollinger Bands when they wish to get an indication of volatility. This indicator is composed of two bands that surround a moving average, and they swell and shrink with changing volatility. For this purpose, the pair’s trading range is used for calculating the standard deviation (SD).
Generally, a period of 20 is used for the moving average, and the bands are situated at distances of +2SD and -2SD from it. When the volatility for a pair increases, the bands expand, and when it falls, the bands start shrinking.
- Moving Averages
These are used to portray the mean price of a pair for a certain time period. For instance, if you plot 20 simple moving averages, you would get the mean price shift for the preceding 20 days. If you see the moving average deviating from the price, it shows that the volatility level is high.
Conversely, if the moving average proceeds towards a price line or intersects it, it is a manifestation of low volatility.
Summary
Now that you have a basic idea about volatility, you should take it into account while trading in currency pairs. You ought to gain a certain degree of understanding of the various elements that influence volatility. By doing this, you can precisely forecast how the market would react after the occurrence of a major event or even before it.


