If you are new to the world of forex, you will soon notice that traders have many tools at their disposal to aid better decision-making. The tools are the fruits of the dedication of hardworking experts who felt compelled to share a piece of their knowledge with the community.
Alan Hall Andrews is one of those experts. The Harvard and MIT-educated thermodynamics engineer fell in love with investing and ended up creating one of the most valuable indicators of all time, the Andrews’ Pitchfork. This article discusses the indicator and explains how traders can exploit its full benefits during technical analysis.
Andrews’ Pitchfork: What is it?
Andrews’ Pitchfork dates back to the pre-digital era market analysis that was accomplished using an analog calculator and a brilliant mind. Some accounts say that Alan H. Andrews developed this indicator specifically for the equities market and that its initial name was The Median Line Method.
The Median Line Method was a part of a $1,500 course that Andrews sold in the late 1960s and early 1970s under the The Action-Reaction Course title. The 60-page pamphlet laid out the principles of trading for profit, such as drawing a single line between a recent high and low price would enable you to predict a stock’s price. This became the bedrock of Andrews’ Pitchfork.
The structure of Andrews’ Pitchfork
It is worth noting that Andrews’ Pitchfork is more appropriate in a trending market, whether upwards or downwards.
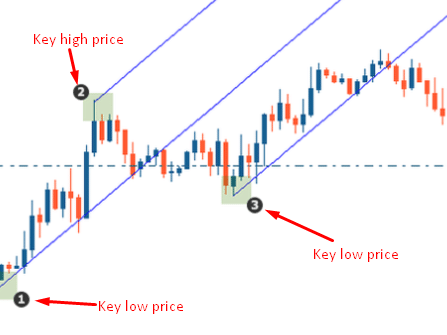
Figure 1: Andrews’ Pitchfork in an up-trending market
The indicator has three key points. In an up-trending market, there are two low price points and one high price point; see figure 1.
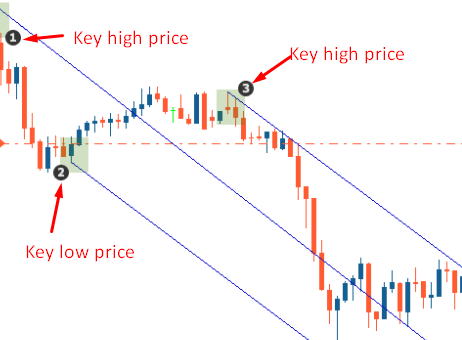
Figure 2: Andrews’ Pitchfork in a down-trending market
In figure 2, notice the difference in the positioning of the critical price points. Also, the slant of the three trend lines is downwards.
How to construct the indicator on a chart
Plotting the Andrews’ Pitchfork begins with identifying the three critical price points on a chart. It is best to always focus on the most recent trading sessions to increase the accuracy of the setup.
In figure 3 below, we have highlighted the three price points we believe are crucial in the analysis. Sometimes, traders refer to these prices as the critical turning or pivot points.
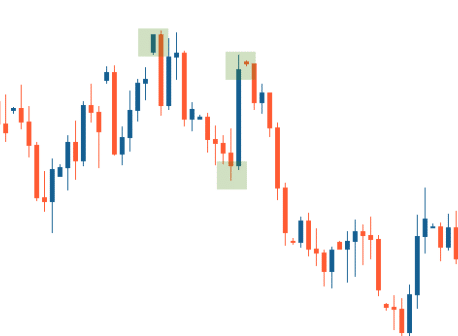
Figure 3: Plotting the Andrews’ Pitchfork on a chart
Next, draw a ray in the middle of the two turning points, as shown below. Make sure the ray starts from the first critical pivot point. Let the line run the entire length of the price chart – it forms the indicator’s median line, which is also the ‘handle’ of the Andrews’ Pitchfork.
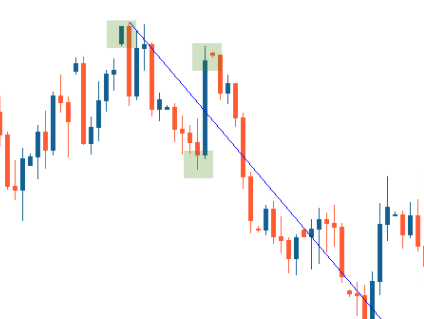
Figure 4: Plotting the Andrews’ Pitchfork on a chart
Draw the remaining lines starting from the two pivot points on either side of the central line. Let the lines run parallel to the ‘median’ line all the way to the end of the price chart, which are the two prongs that complete the Andrews’ Pitchfork – see figure 5.
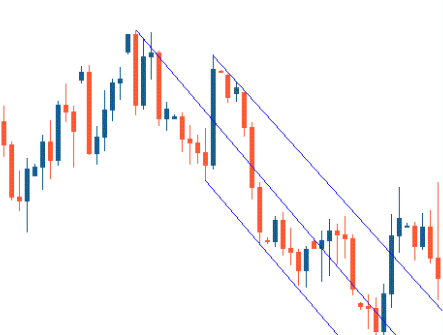
Figure 5: Plotting the Andrews’ Pitchfork on a chart
You might have noticed that the trickiest part of the indicator is identifying the critical highs and lows. As such, you need to exercise utmost care during the exercise if the plot is to serve its purpose well.
Applying the indicator in MT4
In a moment of brilliance, Alan Andrews realized that price action tends to drift towards Pitchfork’s ‘handle’ and bounce off the prongs on either side. Also, and as shown above, the indicator identifies a trend and trend reversals.
Look at the MetaTrader illustration below, showing the EURUSD’s trend. Since the opening of trading on June 29, 2021, the market sentiment has shown a bearish bias. A Pitchfork on the chart follows a declining gradient.
Therefore, the indicator tells you to short the EURUSD pair. The problem is this: where should you enter the market ?
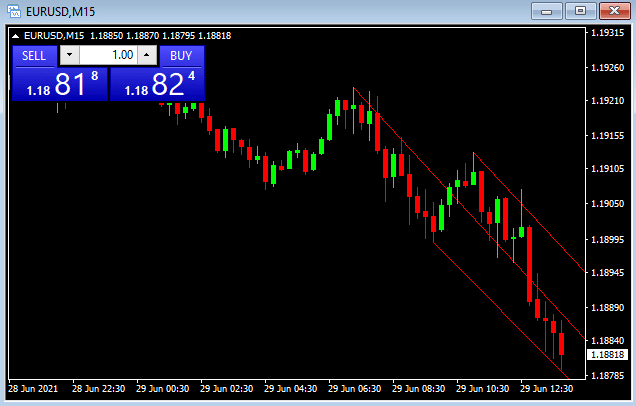
Figure 6: EURUSD 15-minute price chart
However, adding an RSI offers a clearer view of the setup and where the correct decision lies. Notice in the figure below that the RSI is turning, meaning the buyers are coming back into the EURUSD market.
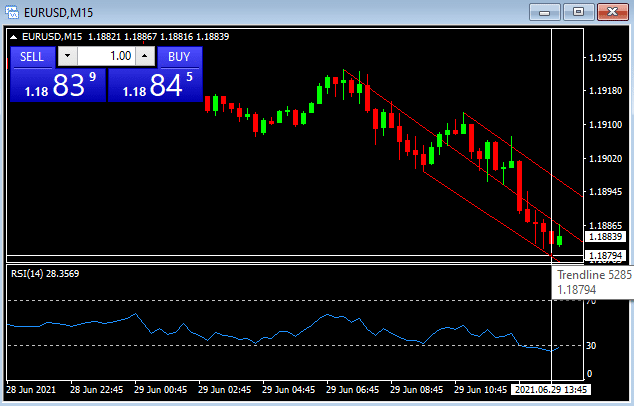
Figure 7: EURUSD 15-minute price chart
Also, a bullish candle just formed. From the preceding, the ideal move here is to go long EURUSD, and the appropriate entry point is 1.18794.
How to trade off critical levels with Andrew’s Pitchfork
Andrews’ Pitchfork can also play a supporting role to other indicators. For instance, you could use the tool to identify critical resistance and support levels. The indicator forms a channel within which the price action oscillates. The channel’s lower prong defines the price action’s support level during up-trending market activity, while the upper prong defines the resistance level.
In such a setup, Alan Andrews explained that the trend is strong when prices reach the central line regularly. This means the buyers are showing sufficient resolve to hold the trend for a long time. On the contrary, the trend is weak when the price fails to reach the central line.
For example, the price action in figure 7 reached the central line in four of the last 15-minute candles. The behavior indicates underlying strength on the side of buyers and the thinning out of the selling pressure.
But what happens when the price breaks outside the channel? Although breakouts do not happen frequently, the setup in figure 7 tells you that they are not rare. When a breakout happens, the indicator could be signaling a trend reversal.
If the breakout takes the market side opposite to your position, this is a signal to adjust the rules of your position. Failure to do so could lead to massive losses. Therefore, it is crucial that you set up stop-loss orders to protect your position against sudden price spikes.
Conclusion
The Pitchfork would appeal to discretionary traders who want more flexibility with the chart analysis. As such, the accuracy of the setup is a function of how well you place the three pivot points.


