Overbought and oversold are important levels in forex trading because they provide good points to enter and exit trades. In this article, we will look at what the two levels are and some of the top strategies to use to find them.
What is an overbought level?
An overbought level is a period when the price of an asset like currency pair, stock, commodity, or exchange-traded fund (ETF) has risen so high that it is way above its perceived intrinsic value. In technical analysis, an overbought level is often seen as being equivalent to overvalued in fundamental analysis. For example, if the USDCHF pair is trading at 0.8700 and then it moves parabolically to 0.9200, it can be said to be overbought.
What is an oversold level?
An oversold level is when a currency pair declines considerably such that it moves below its “normal” value. It is the opposite of an overbought level. For example, in the chart below, we see that the USDCHF pair declined substantially in October 2021.
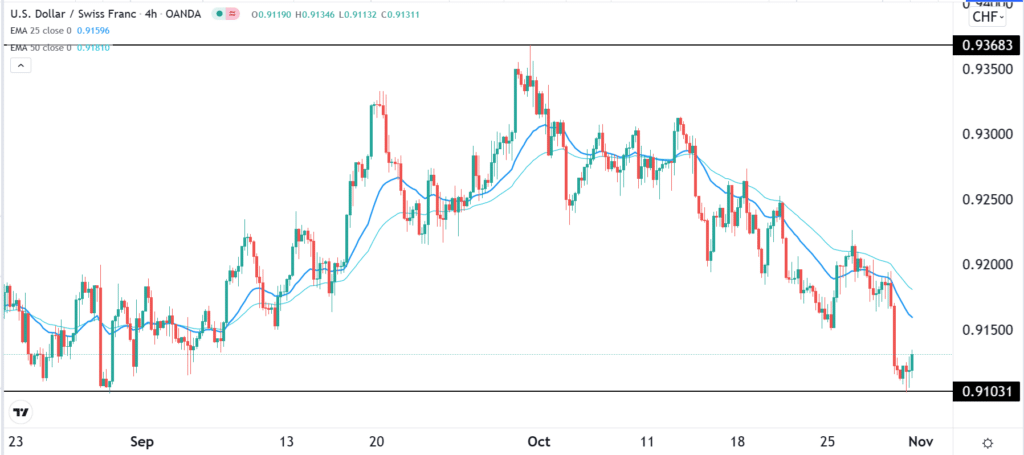
It moved from a high of 0.9368 and fell to a low of 0.9100. Therefore, some traders can point to the fact that the pair got highly oversold.
Why overbought and oversold levels are important
Day traders and long-term investors always pay close attention to critical levels. There are two main reasons why they are essential. First, the two levels can help a trader identify entry levels. The most popular approach is to buy a currency pair when it moves to an oversold level. One can also place a sell trade when the pair moves to an overbought level.
Second, the two levels provide good signals of when to exit a trade. For example, when you are long a currency pair and its price moves to the overbought level, it can be a good sign for you to exit or start winding down your trade. Similarly, if you are short a currency pair and it moves to an oversold level, it can be a good time for you to start exiting the trade.
How to identify overbought and oversold levels
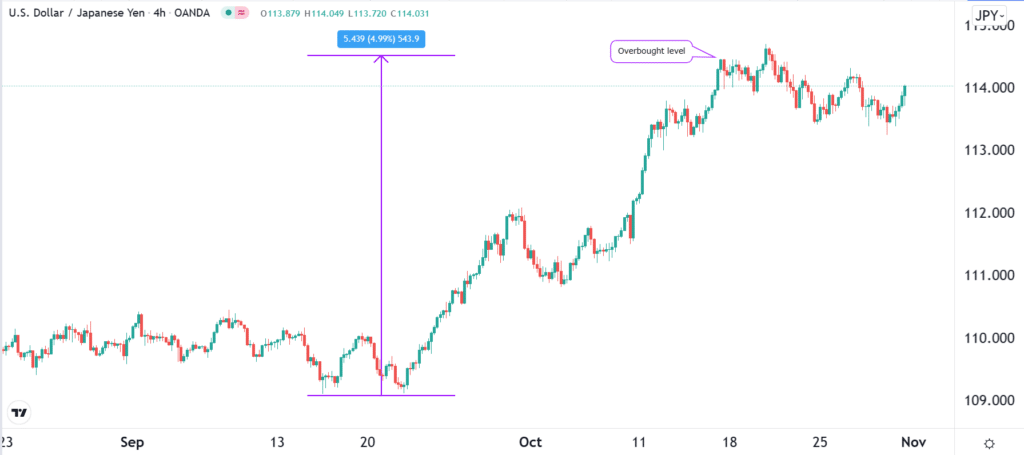
The easiest method of identifying the two levels is visual. Even without using an indicator, you can look at an asset and see whether it is overbought or oversold. For example, in the chart below, we see that the USDJPY jumped by about 5% within a few weeks. In stable currencies like the USDJPY, 5% is usually significant. Therefore, there is a possibility that the pair can be considered to be overbought.
In addition to this, oscillators are another popular method of identifying price extremes. Let’s look at some of the most popular oscillators to use.
Using the Relative Strength Index (RSI)
The RSI is helpful to find the extremes of price fluctuations. As its name suggests, its goal is to identify the relative strength of an asset. The indicator is calculated by first finding the relative strength of a currency pair. This is done by dividing the average gain by the average loss. After this, you divide the figure by 100. Finally, you subtract this figure from 100.
The relative strength index is provided by most brokers and trading platforms like TradingView and MetaTrader. The currency pair is said to be at the oversold level when it declines below 30. It is then said to be extremely oversold when it moves below 20.
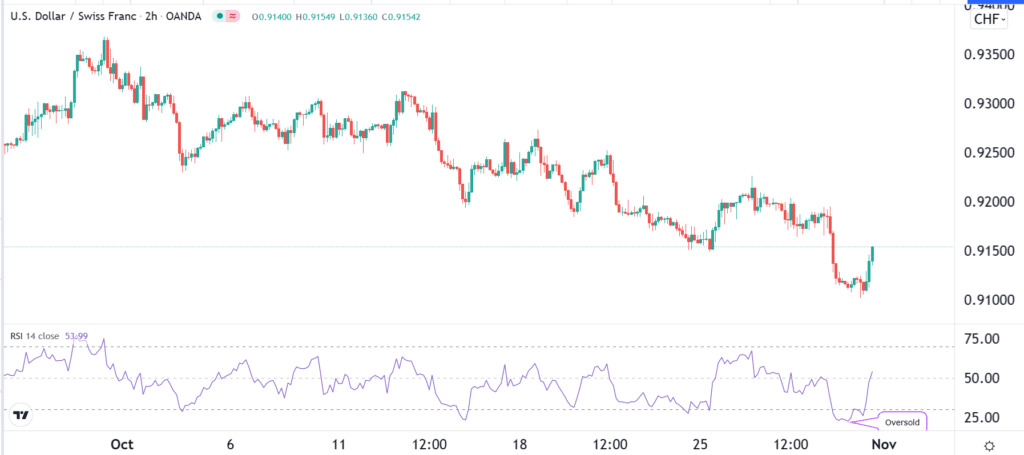
On the other hand, it is said to be at the overbought level when it moves above 70 and extremely overbought when it rises above 90. However, these numbers are not static, and many traders tend to tweak them to match their trading strategy.
USDCHF in the illustration above dropped to an oversold level.
Money Flow Index (MFI)
The MFI index is closely related to the RSI. Indeed, a closer look at the two indicators shows that they have a close resemblance. They look alike simply because the MFI indicator is a version of the RSI that includes the volume of the asset.
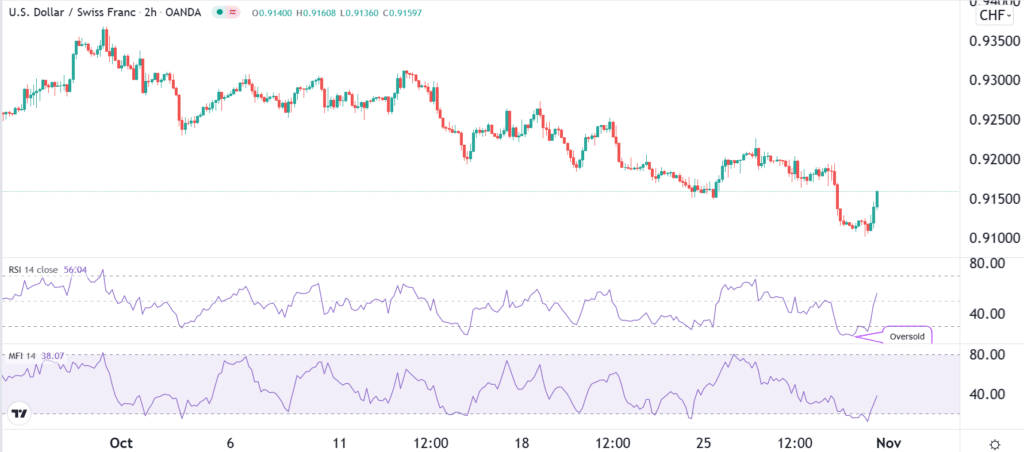
The main difference between the two is that the oversold level of the MFI comes at 20 while the overbought level falls at 80. In the chart above, I have added the MFI and the RSI so that you can see how similar they are.
MACD
This tool is different from the previous two indicators. Instead, the indicator is made up of two differently-colored lines and a neutral one. It also has a series of histograms. The MACD is calculated by simply converting two Moving Averages into an oscillator.
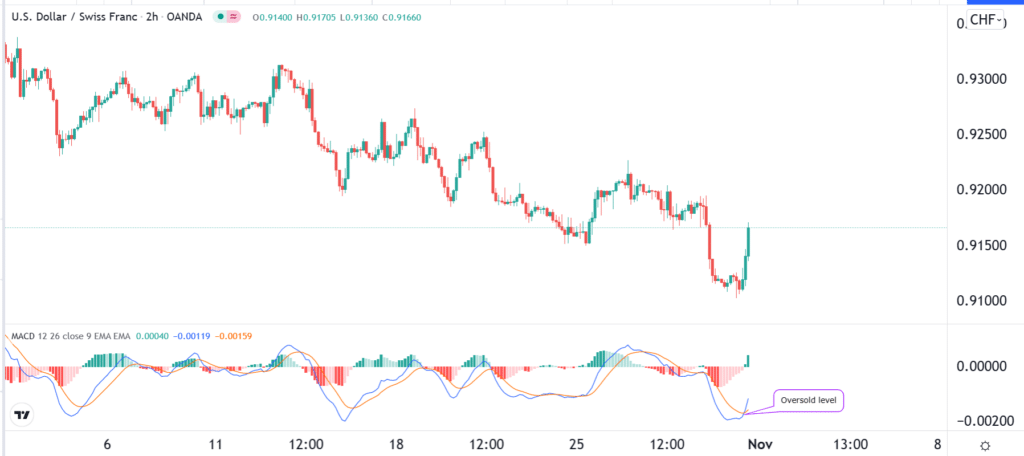
Overbought levels happen when the two lines have crossed the neutral level and are significantly above it. Similarly, oversold levels happen when they have crossed the neutral level and are substantially below it. In most cases, buying trades are implemented when it gets overbought and when the two lines make a crossover.
Other useful indicators include the Relative Vigour Index (RVI), Commodity Channel Index (CCI), Kiplinger Oscillator, and Awesome Oscillator.
Summary and caveat
While the two levels are essential, there are several things you need to know. First, the fact that a currency pair is oversold does not mean that you need to buy it. Many times, the pair will keep falling even when it has moved to the oversold level. Therefore, you need to use other techniques such as price action to predict the direction. Also, a multi-timeframe analysis can help you avoid making mistakes because an asset can be overbought in one timeframe and not in another one.

