
The promise of huge returns is a big lure when it comes to Forex trading. But, just like any other venture, you need to be well prepared to taste success. One step towards this endeavor is to know how to read charts. Learn about how these figures play a crucial role in exchange rate trades.

What Is a Forex Chart?
A chart is an image that represents the price of currency pairs over a specific span. You will be able to understand the prevailing patterns and trends. The image representation includes formations such as:
- Triangles
- Channels
- Tops and bottoms of various styles (double, triple, saucer, etc.)
- Gaps and more
Another benefit of such images is that you can assess the support levels. You can identify the previous upside reversal point below, which you can enter your trade.
It is also possible to find the downside reversal point where you can exit, which is also called a resistance level. This is where traders face resistance to an upward move. These can be used for any particular currency pair you want.
Time frames are important in charts as they are set based on a specific time, such as a 24-hour time frame. There are others that are set with minutes, months, etc.
3 Types of Forex Trading Charts
Learning about the major chart patterns will help gain better insight on reading the formations and arriving at the appropriate conclusion. While there are different formations used, here are three basic and most widely used formations to know.
1. Line Charts
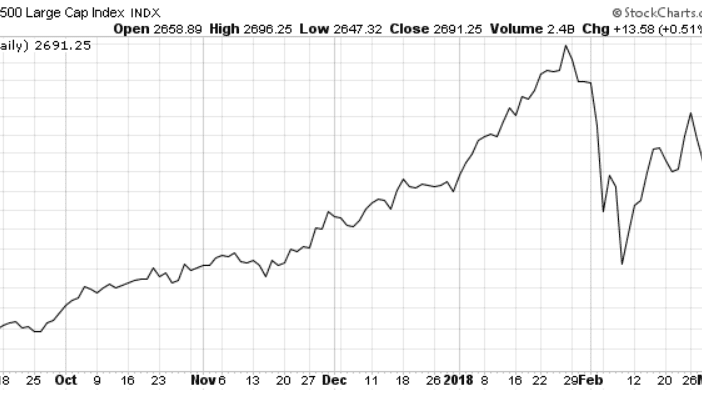
These consist of lines that connect closing prices over a specific span in the line form. While these are representative of the closing rates, they can also indicate low and high rates.
Benefits include:
- They can identify overall price moves and other similar broad patterns.
- With the information provided on the closing levels, traders can ignore the fluctuations inside a session.
2. Bar Charts
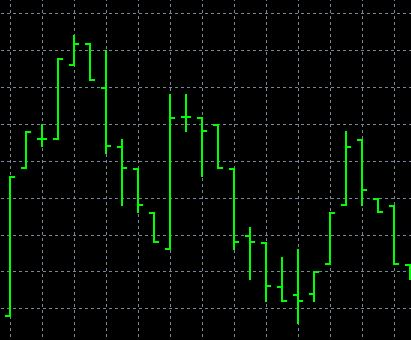
Unlike the line chart, this chart has more details included in it. You can view all the different price levels. Traders can identify the price range for every period. There are different sizes of bars added in a chart.
A typical bar has three different sections. The lower part shows the least price quote, while the upper part indicates the maximum price quote. The entire bar is representative of the price range of a specific currency pair.
The length is directly proportional to the fluctuation of price. So, high volatility will result in larger bars, while low volatility will show smaller bars. This is because the entire length is representative of the price range.
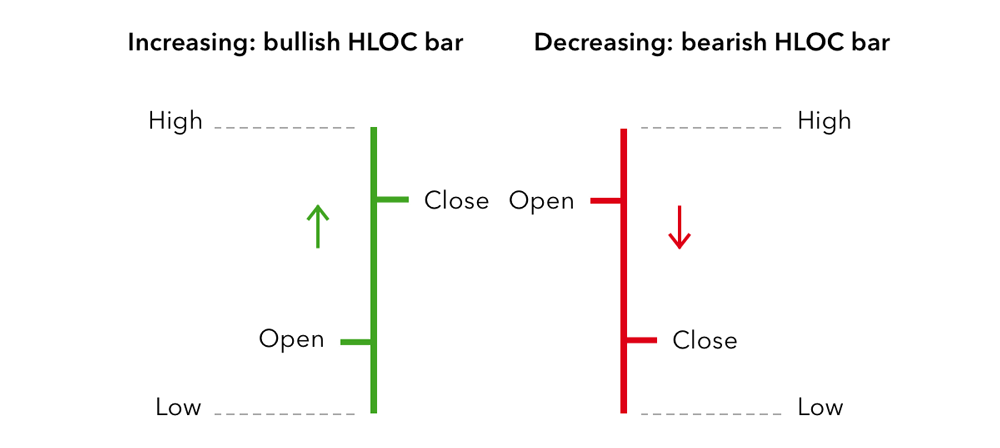
Another use of the bar is you can identify the close and open rates using the horizontal lines attached to the vertical line. The left side line denotes the opening price, and the right side, the closing rate.
Hence, here are the benefits bar charts have to offer you:
- They can identify gaps in the exchange rate.
- They can confirm the closing of rates over a specific point that can end in a breakout.
3. Candlestick Charts

A slightly modified version of the bar pattern, this Japanese version is easier to understand. The larger central part is representative of the price range, while the vertical lines (wicks) are denotative of the maximum and minimum price.
Plus, the short and long wicks signify market behavior. The color of the candles denotes the bearish or bullish market form. A filled body indicates that the currency pair closes at a lower point than its opening rate.
Here is what makes the candle charts so popular in trading:
- They can identify relative positions of the price at its opening and closing level.
- They are visually easier and convenient to read.
Using Indicators on Your Forex Chart
Now that you are familiar with the basic charts, you can use technical analysis to spot trends and ranging prices, so your entry and exits are appropriate. The indicators help in accomplishing this. Here are a few important ones.
Moving Average (MA)
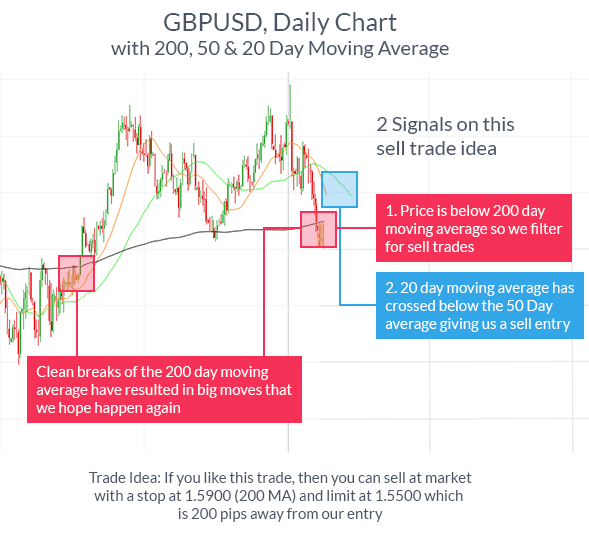
This helps in identifying trading moves in the direction of the trend. It is just a line that is formed by plotting average rates over a specific span. Plus, it helps to identify trends and find the precise time for selling or buying.
Benefits for you are the following:
- You can read momentum and leverage it by making entries while the price movement is in the same direction as that of the MA and making an exit when opposite directional movement occurs.
Bollinger Bands
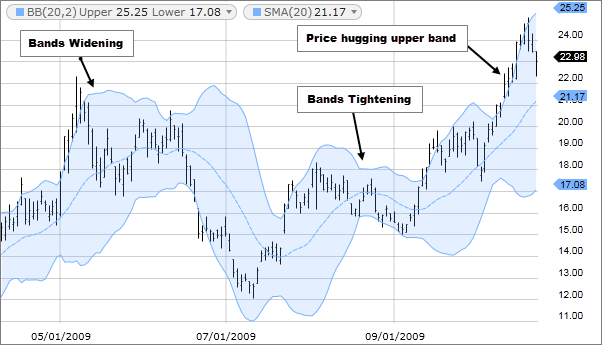
Named after John Bollinger, the developer, these are envelopes that are entered at a specific standard deviation level over and under the SMA. The standard deviation determines the band distance, which helps them adapt to volatility swings in the price. Bollinger bands work in conjunction with MAs only.
This indicator has a number of advantages:
- You can determine the maximum and minimum range of price on a relative scale.
- The large separation of bands indicates high volatility and the end of an existing trend.
- The movement of price from one band to another helps spot probable profit points.
- When the price exits the bands, it indicates a powerful trend.
Relative Strength Index (RSI)
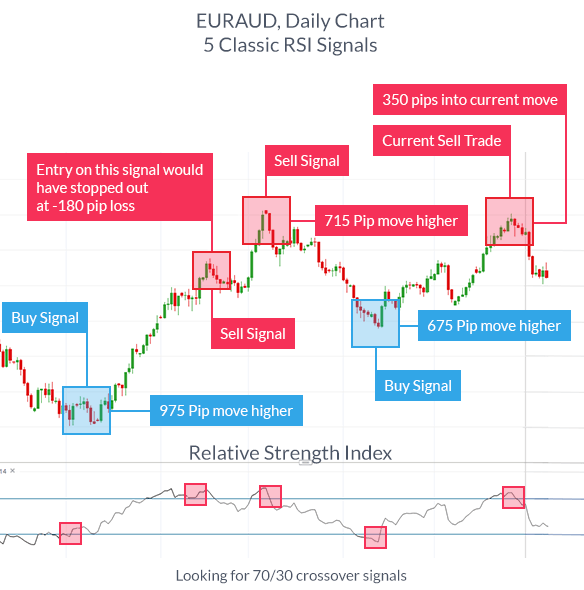
RSI denotes an oscillator used for determining whether a particular currency is sold or bought excessively over its original price, indicating a likely reversal. Values plotted for this indicator range from 0 to 100. The higher range denotes the overbought condition and downside reversal trend, while the lower value denotes overselling, and the upside reversal is predicted.
RSI gives you the following advantages:
- It helps traders who prefer to buy low and make profits by selling high.
- It is used in ranging markets for appropriate exit and entry points.
- It is used in trending markets where you are sure of your trading move, which is in the trend’s direction.
Final Word
With the information you read from various charts, you can understand the market price movements easily, which is the crux of Forex trading. Using indicators will further enhance your perception of the momentum, assessment of various influencing factors, and the decision whether it is buying or selling.
Thus, these tools are vital for your foray into Forex and should be used as much as possible. However, the above tools are just a few of the numerous instruments you can learn and use with success.

