What is ADX?
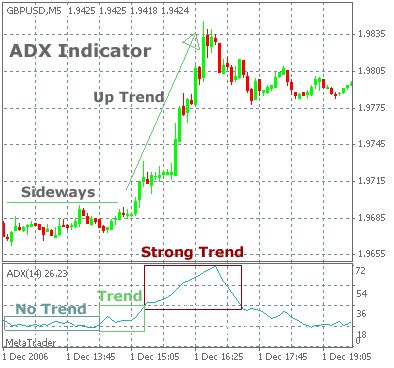
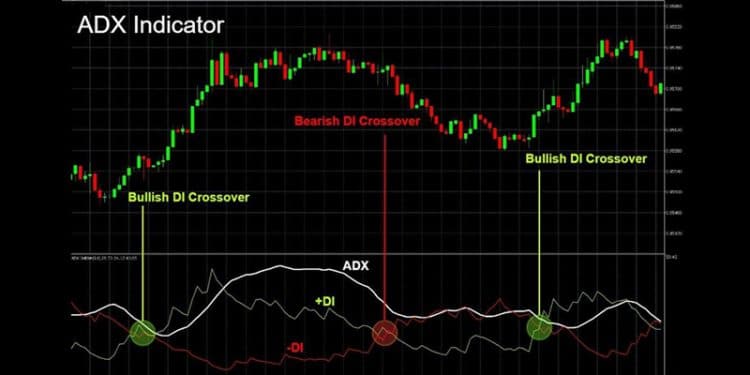
ADX stands for the Average Directional Index. It is a technical indicator that traders use to determine the strength of a trend. Two accompanying indicators such as the Positive Directional Indicator (+DI) and Negative Directional Indicator (-DI) show whether the trend is up or down. ADX includes three separate lines commonly that you can use to assess whether you should take a trade long or short. You can also decide if you should take the trade at all. Although ADX is mainly used for commodity daily charts, yet you can use it in other timeframes and other markets. When +DI is above -DI, the price is moving up.
Similarly, when -DI is above +DI, the price is moving down. You can see crosses between the +DI and -DI. Those are the potential trading signals when bulls or bears gain the upper hand. When ADX is above 25, the trend is strong. If ADX is below 20, however, then the trend is weak, or the price is trendless. Keep in mind that non-trending does not mean that the price is not moving because it could be making a trend change. The price may also be too volatile to have a clear direction for the time being.
History of ADX
J. Welles Wilder developed the Average Directional Movement Index (ADX) in 1978. He referred to ADX as an indicator of trend strength in a series of the prices of financial instruments. Today, ADX is a widely used indicator in technical analysis. Several trading platforms offer it as a standard in collections of indicators.
How ADX Can Be Adjusted
The ADX indicator trading rules make sure that traders only trade during a strong trend on the daily chart. To make the best use of the indicator, you need to look for selling opportunities. You may follow these steps to do this:
- Wait until the ADX indicator shows a reading above 25: Before you see whether the market goes up or down, you have to wait until the ADX indicator displays a reading above 25. According to the trading rules of the ADX indicator, a reading above 25 signals a strong trend and the potentials of a developing trend. You already know that the trend is important, but if it does not have real strength behind it, then it can fade away quickly after forming. To measure the direction of the trend, you also have to look at the actual price action.
- Determine the trend and develop a bearing trend: No matter what your time frame is, you need a practical way of determining the trend direction. You can do it by using a sample size of 50 candlesticks and it also ensures that you are trading in the moment of now. If the price heads lower during the last 50 candlesticks, then you are in a bearish trend. Next, you have to focus on the catalyst that triggers the sell signal for the best ADX strategy.
- Sell during the break of RSI indicator with a reading below 30: RSI indicator uses the same settings as the ADX. You can use the RSI for your entry signal. Normally, when the RSI shows a reading below 30, it indicates an oversold market and a reversal zone. However, sometimes you need to look beyond the typical rules. If the ADX defines the trend to be a strong one, then sell when the RSI breaks and shows a reading below 30. After that, you need to establish the zone for placing your protective stop loss.
- Place the protective stop loss at the last ADX high: To select the location of the stop loss for the best ADX strategy, you need to first identify the point where the ADX made the last high before your entry. Next, you can find the corresponding high. It will be on the price chart from the ADX high. That location is your stop loss level.
- Take profit when the ADX breaks back below 25: The ADX strategies tend to capture profits when a strong trend is present. Once the strong trend fades away, you have to wait for another trading opportunity before taking profits. To accomplish this, you must take profits when you see the ADX indicator breaking back below 25 because it implies that the trend is weakening.

Basic Strategies Using ADX
- ADX in the DM system: DM stands for the Directorial Movement. Although the ADX is useful enough on its own, it used to be a standard part of Wilder’s DM system. The DM system includes three lines, such as ADX measuring the strength of the trend, DI+ measuring bullish movements, and DI- measuring bearish movements. If the ADX is above a threshold set at 20 or 25, then you can interpret that in a bullish movement, DI+ is greater than DI-, and in a bearing movement, DI- is greater than DI+. However, it is a basic system. If you want it to be profitable, then you need to refine it with other tools like volume and price action.
- ADX price divergence: All you need to know in this strategy that the ADX value should rise as a trend develops. However, what happens if the ADX falls instead? This divergence implies that the ADX is issuing a warning against the trend. It is similar to the divergences we can see in RSI and MACD oscillators. The difference is that the ADX is not directional on its own. Traders have noticed that ADX divergences work better when the first ADX crest is above 40.
- 2-period ADX: In a 2-period ADX trading strategy, traders do not find trends. Instead, they apply this strategy to find imminent breakouts.
- ADX v/s ADXR: ADXR, which is a smoothed ADX, is not a trading strategy, but it is a tool to find more conservative signals. If you replace the ADX with the ADXR in any approach, then you will filter out the more aggressive signals. Another way you can deploy the ADXR is by plotting it together with the ADX. After that, according to their crossovers, traders can judge whether the trend gains momentum or weakens. Compared to observing the ADX only, deploying ADXR offers earlier signals. This concept is similar to the ADX slope method.
- The Holy Grail: The Holy Grail is a classic ADX strategy from Linda Bradford Raschke. This strategy combines a moving average with the ADX. With this combination, you can use price action to find pullbacks.
- ADX with the Parabolic SAR: This strategy develops on the DM system. Sometimes, traders notice that the price action disagrees with the ADX. Under those conditions, it does not make sense to rely on DI crossovers for entries. As Wilder has stated, traders can get a better entry by using the system in conjunction with the Parabolic SAR. You can establish your market bias by using the DM system and look to Parabolic SAR for trade triggers. The Parabolic SAR also guides in exiting from the market.

The Bottom Line
The information ADX strategies provide us is very useful because trades tend to avoid a trend that is not moving. However, by applying the ADX indicator in your strategies, you can benefit from the strength of the trend which will help you to cash in quick profits. By catching strong trends, the ADX indicator helps you to accomplish your trading goals.


