
The formation of a double top pattern
The pattern indicates an uptrend reversal, with the pattern followed by a downtrend. Three key structures characterize it and include two peaks tops and a support level. Each top is formed after a price surge.

After getting to the first peak (see 1st Top), the market lacks the momentum to keep the price rising. Therefore, the price begins to fall, following pressure from the bears.
The market declines to reach the neckline, from where the bulls push the price up to another peak (see 2nd Top).
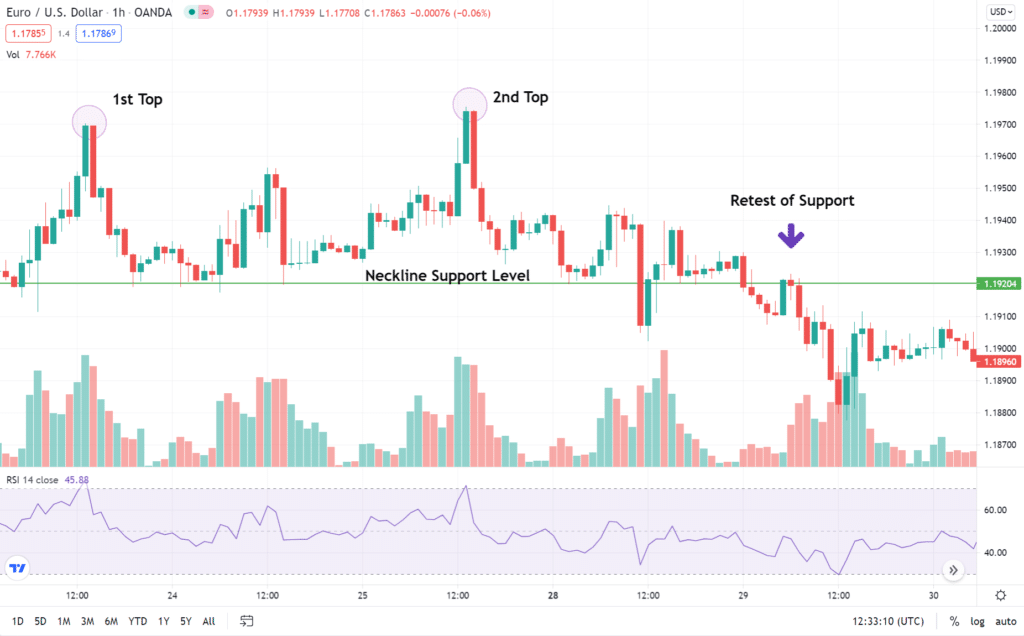
Once the price rally hits the peak for the second time, the market once again fails to sustain the price upsurge, and it reverses downwards once again. However, during the second downturn, the price depreciation goes past the support level (See Neckline Support Level). Consequently, this confirms a bearish reversal.
After the price breaks down the neckline, it may retest it, providing additional entry opportunities to short the asset. In the chart above, you can see how the price retested the support-turned-resistance and declined afterward.
The formation of a double bottom pattern
The formation signals an imminent end to a bearish market condition. Its completion often transitions into a bullish run. Its resistance is established at the neckline.
When the market bears fail to sustain their momentum, the price action leads to the formation of the two lows. In the first instance, the price gives in to market pressure, leading to a downtrend. However, upon reaching the price at the first bottom, the bulls may fight back strongly. This propels the price upwards up to the resistance.
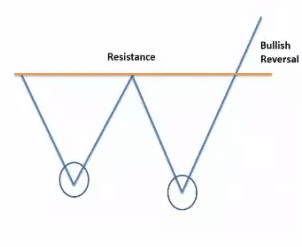
Once the price rally fails to go past the resistance, the bears take charge, hence causing another downtrend. This causes the price to reach a second low, and therefore the second bottom is formed as a result. At this point, another bullish fight back comes with a strong upward push, which drives the price past the neckline. This results in the breaching of the previously established resistance level. Consequently, this confirms the completion of a bullish reversal.
How to find price targets
We may not always predict the location of the next price level with precision by simply looking at the previous pattern. However, the price action can give us useful hints on the next likely level where the price will touch.
One of the most common ways to do this is to use the length of the previous uptrend or downtrend and use it to get the next potential price target.
In the case of a double top pattern, you can estimate a realistic profit target if you measure the number of pips from the top to the support level and use it to extrapolate the target.
Similarly, the measure of the length from the lows to the resistance level can help us locate the profit target, which in the example below will be at $1.13228. This approach assumes that the market fundamentals will remain relatively unchanged during that trading period, from the moment we saw a reversal on March 3, 2016, till March 21, 2016.
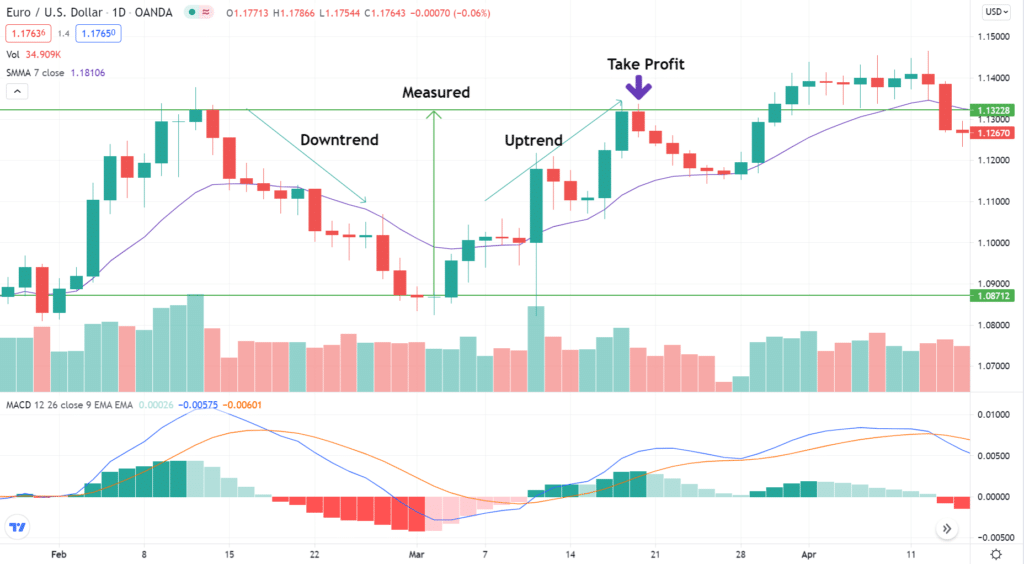
This method is not foolproof, and therefore you should incorporate the relevant technical analysis tools such as MACD and Bollinger Bands to help confirm the viability of the target you have set.
For MACD, a strong price rally is indicated by the MACD line’s crossing of the signal line from bottom-up and vice versa. Hence, in the chart above, we would have received the confirmation of the uptrend on March 10.
With the Bollinger Bands indicator, if the price moves outside the envelope, it points to a possibility of a continuation of the current trend (see below).
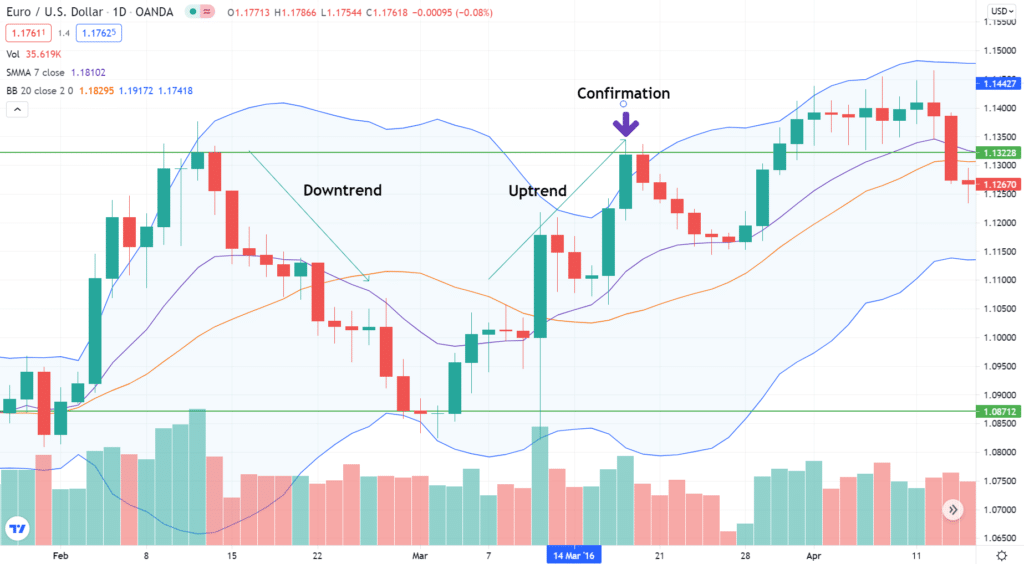
The fundamental thing to remember when interpreting these patterns is the element of limited accuracy. It is also ineffective in instances where the market forms a false reversal. Therefore, as cited above, you should use other relevant technical analysis tools to validate any reversal signals.
Tips to follow in trading with double top
This pattern may mislead you into reaching for the wrong profit targets. Therefore, to avoid this and minimize chances of making losses, you should adhere to the following rules:
- The previous trend before the formation of the pattern must be an uptrend. This will help build a strong case that the uptrend was in play previously but is now weakening.
- The formation of the two tops should be rounded; that is, you should wait for at least two candles to confirm that the price has peaked.
- Short the market once the price has breached the support. This will be a clearer sign of a bearish reversal.
- Put your stop loss at the second peak.
Tips to follow in double bottom trading
The approach to reaching profit targets for both patterns is based on the same concept. The profit target is achieved by doing the following.
- Study the previous price trend to establish whether it was an uptrend or a downtrend. Since a double bottom gives way to a bullish trend, ensure that the previous trend was a downtrend.
- The size of the lows’ bottoms matters. Don’t rush to open a position based on the bottom but wait for at least two candles to confirm each of the two lows.
- Go long only after the prices go beyond the resistance level. This will be a confirmation that a bullish reversal has occurred. In addition, it will protect you from a potential false breakout.
- Place your stop loss at the second bottom.
In summary
Double bottom and double top patterns can be useful in identifying profitable trading opportunities. They provide good signals for trading reversals. You should use them with other relevant indicators and incorporate fundamental aspects of the market as a way of confirming the reversals. You should also follow the rules of trade to optimize profitability and minimize risk.

