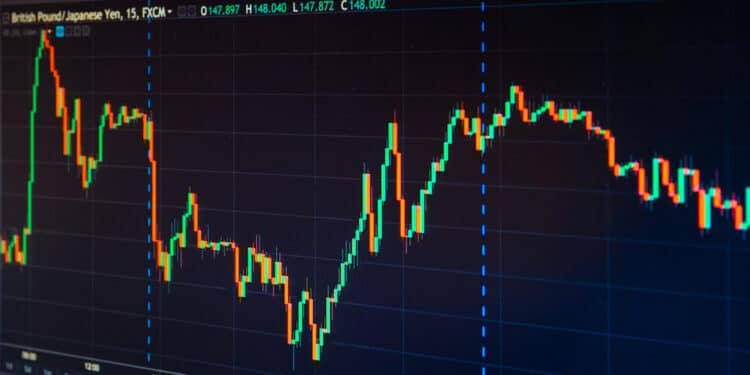
Introduction
The flag is a rectangular pattern in a trading chart formed by two short-sloping parallel trend lines. It describes a trend continuation.

Currency prices rise until the flag pattern is formed before pausing. It slopes downwards, then confirms an uptrend in an upward breakout or a downtrend in a downward breakout. However, the trader has to wait until the breakout is confirmed to enter the trade.
A flag can also be formed from a prior downtrend. Here, the pattern will slope upwards rather than continuing downwards. After confirming the downward breakout, it will proceed with the bearish continuation.
Formation limit of three weeks
The flag pattern’s formation takes three to five weeks to form. It can take as long as 35 trading days, depending on the pair’s price movement. Short flag patterns may have a weaker prediction as compared to longer patterns.
Declining volume
The volume of the price trend declines during the formation of the flag pattern. The volume later increases after the pattern forms, and the breakout occurred.
Flag forms in a steep trend
In the downtrend, the flag forms from a steep price move (See figure 1 below).
Patterns that form from steep prior price moves have improved performance compared to those with pullbacks before the pattern forms.
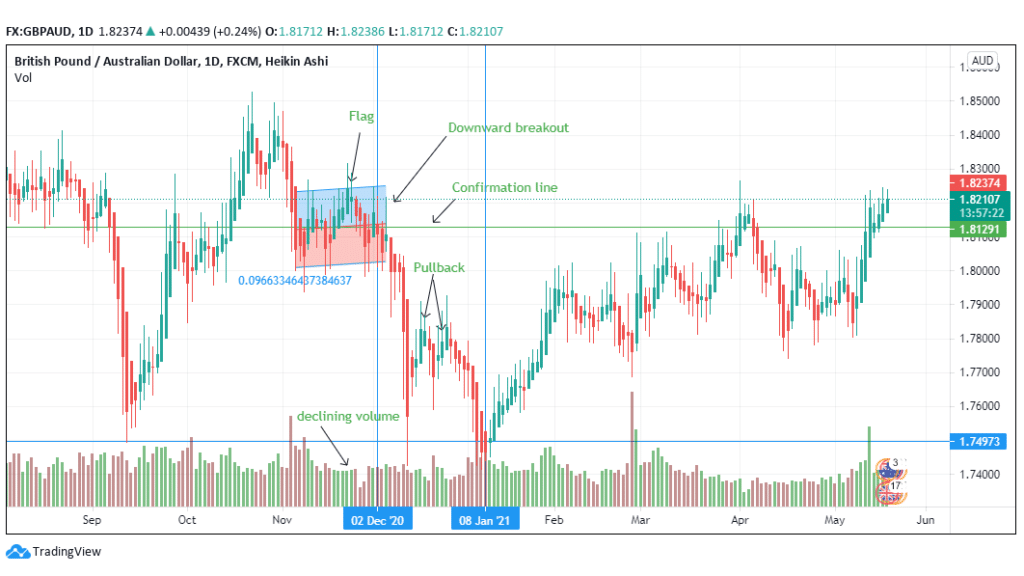
Figure 1: Flag pattern appearance on the GBP/AUD trading pair
In figure 1, the flag pattern appears after prices fall from 1.8400. The pattern began on November 9, 2020, and the downward breakout is confirmed on December 9. 2020.
The lengthy pattern has higher odds in terms of predicting the short-term bearish continuation. The two pullbacks have stalled the trend continuation. The downtrend resumed from December 2, 2020, to January 8, 2021.
There is a decline in volume as the flag pattern forms indicating a shift in momentum. Selling pressure gradually increases until it overcomes buying, leading to a price fall. The pair trades at 1.7497 on January 8, 2021, showing that the flag has led to a price decline of 4.9%.
While the decreasing volume plays a crucial role in identifying the flag’s performance, a steep prior price movement is considered essential in terms of the breakout’s odds of success. This movement should, in most cases, give way to a downward breakout, while a steep uptrend prior may introduce an upward breakout.
The flag signalizes a pause in the price trend, especially when the movement is at a rapid pace. The lower part of the flag can offer support after confirming the flag pattern.
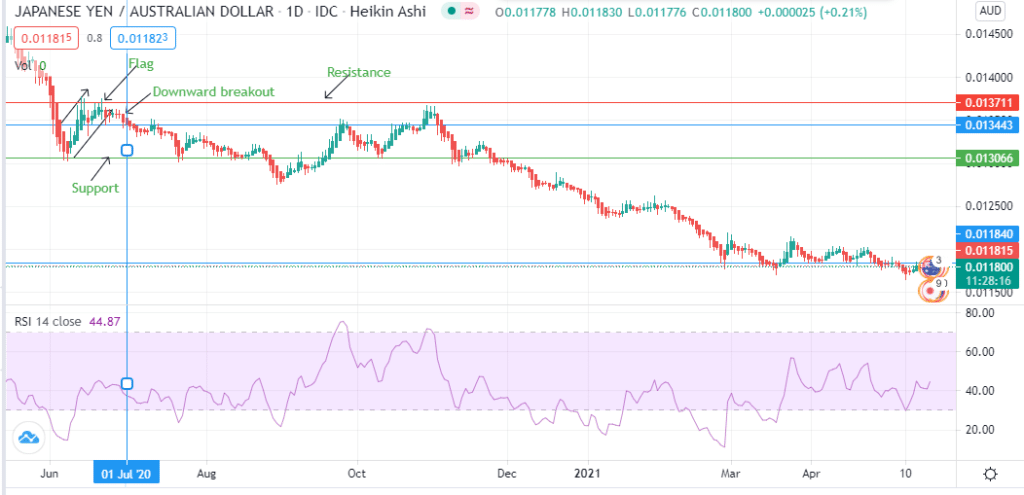
Figure 2: Flag appearance in the JPY/AUD trading pair
In figure 2, the flag pattern appears in June 2020 from a prior steep price movement. It rises until it confirms the downward breakout on July 1, 2020, at 0.01344. The upper part of the flag pattern forms the resistance at 0.01371.
The lower part of the flag acts as the support at 0.01306. Although, the market rebounded up from the support. Eventually, the price broke the flag’s down boundary, triggering the trend continuation.
The downtrend in the JPY/AUD continues from July until September 2020, showing the correct prediction of the flag pattern from a steep prior price movement.
Figure 2 also shows the 14-day relative strength index (RSI). At 30, the index indicates the pair is oversold, while at 70, it is overbought. Selling action increased after the downward breakout was confirmed. The decreasing RSI also confirms the increased selling pressure.
Trading guidelines
- Price target
After identifying the flag pattern, use the measure tactic by subtracting the upper price with the lower portion. In the case of a downtrend (i.e., in a downward breakout), the price will be subtracted from the minor low of the flag. In an uptrend, the price difference will be added to the minor high of the formation.
- Wait for the confirmation of the breakout
Only place or enter the trade after the pair’s price moves away from the boundaries of the flag. Additionally, wait for the breakout to confirm before entering. Confirmation allows the trader to have more evidence that the breakout is real and leads to a trend continuation.
After prices get near the target (either in an uptrend or a downtrend), prepare to exit the trade. Use a stop-loss to lower the trade risk if you would like to go past the target price.
Conclusion
Flags that are followed by breakouts have high success rates. The trader should look for support and resistance points after identifying the flag. The longer the flag is formed, the more reliable the pattern is.

