Professional Wall Street investors and traders use Bloomberg and Reuters Eikon terminals to get most of their financial news, calendars, and communications. While these tools are good, they are also expensive, with each of them costing more than $20,000 per year. This is where Investing.com comes in handy. In this article, we will look at what the application is and how you can use it well as a day trader.
What is Investing.com?
Started in 2007, Investing.com has become one of the most popular investing and trading portals in the world. According to SimilarWeb, it is the 14th-biggest investment website in the world globally. It has more than 170 million monthly users, with most of them being from Russia, United States, and Turkey. The website is used by most forex day traders I know.
Investing.com is loaded with thousands of data points from around the world. Unlike its competitors, it has data even from developed and emerging markets. Also, it is a free website that sustains its business through advertisements and subscriptions. Unlike most paywalled companies, the paid version of the website has all features in the free version. The only benefit of paying for the site is to just get rid of the annoying ads. So, here is how you can use Investing.com as a day trader.
The economic calendar
As a forex trader, you probably know the importance of the economic calendar. This is a tool that gives you a schedule of key events that will move the market. Some of the most important events in the calendar are employment numbers, manufacturing and services PMIs, interest rate decisions, inflation, and retail sales.
As a forex trader, we recommend that you always start your trading week by looking at this calendar. Though not mandatory, you can write down the key events on a piece of paper. Doing this will help you to plan your week and know the currency pairs to focus on.
A good thing about the calendar provided by Investing.com is that it is highly customizable. You can select the countries and the importance of the data you want to focus on.
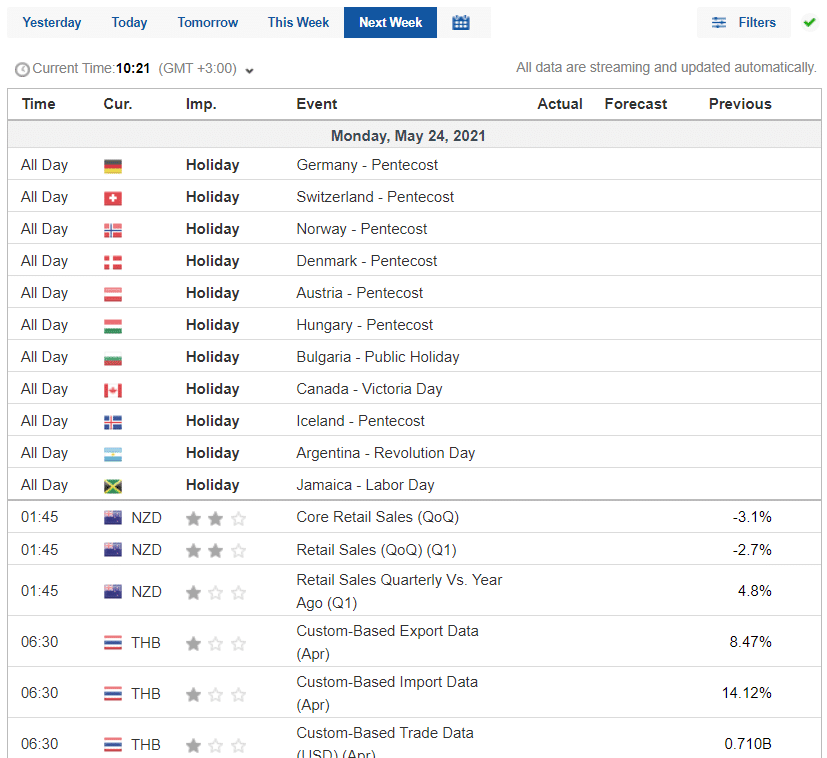
In addition to the economic calendar, you can also use other calendars provided by the platform like earnings, IPOs, holidays, splits, dividends, and expiries. The screenshot below shows some of the key events that will come out in the following week at the time of writing.
Economic calendar
Use the forex correlation tool
A forex correlation is an important concept that is mostly used by pairs and arbitrage traders. It simply looks at the overall relationship between two currency pairs. By looking at this information, you can learn how to trade two perfectly correlated and uncorrelated pairs.
For example, if the GBP/USD and EUR/USD have a close correlation, you can avoid buying or shorting them at once. Also, a parabolic move in one of the pairs can help you predict what will happen to the other one.
Correlation is a relatively complicated mathematical calculation. A simpler -yet longer – approach is to use Google Sheets or Microsoft Excel. Download the data and run a correlation calculation.
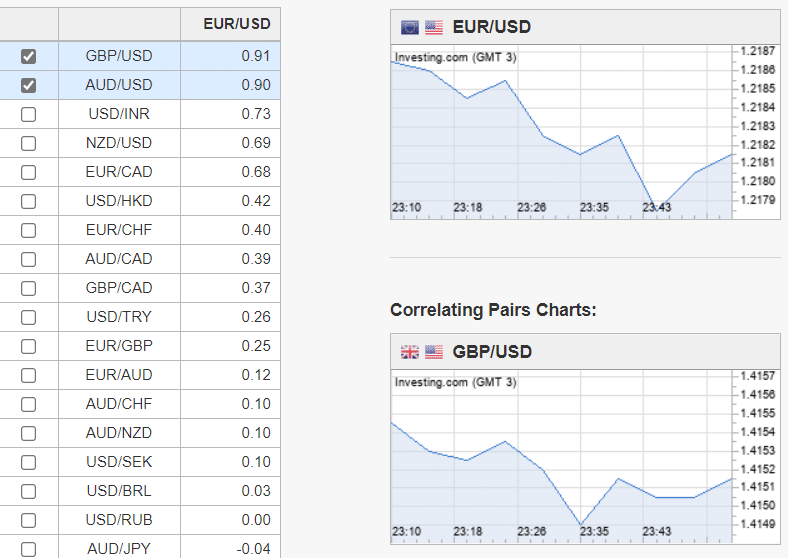
Instead of doing all this, you can use the free correlation tool in Investing.com. With a click of a button, you can find the correlation coefficient of tens of pairs. For example, in the chart below, we see how currency pairs are correlated with the EUR/USD.
We see that the EUR/USD, AUD/USD, and GBP/USD have a correlation of more than 0.90. This means that these pairs move alike. As such, if you buy either of the two, you should expect a similar result. Also, we see that the EUR/USD has a correlation of -0.10. Therefore, having two buy trades on the pair will have a different result.
Forex correlation chart
Using pivot point calculator
Pivot points are essential tools for technical traders because they help to identify the key support and resistance levels. Some examples of pivot points are standard, camarilla, and Fibonacci. Calculating these pivot points can be challenging.
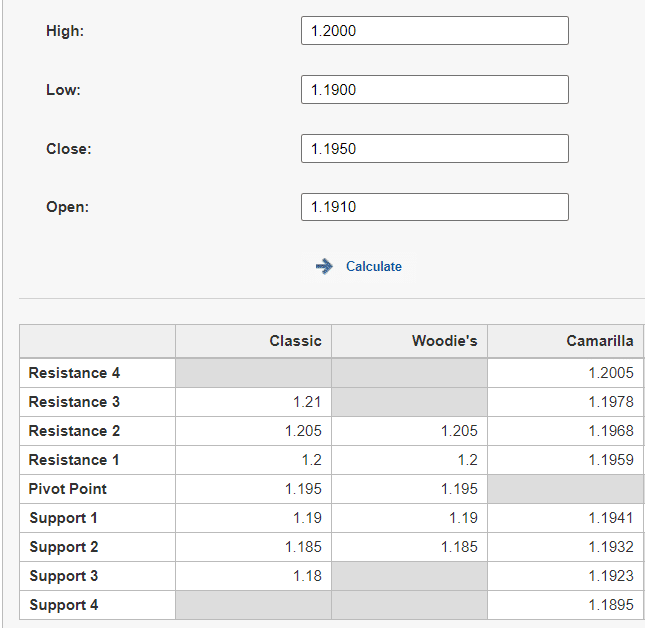
Fortunately, Investing.com offers an automated method to calculate these pivot points. All you need to do is enter the Open, High, Low, and Close of an asset and the tool will instantly calculate the key support and resistance levels. The chart below shows how the tool works.
Pivot points calculator
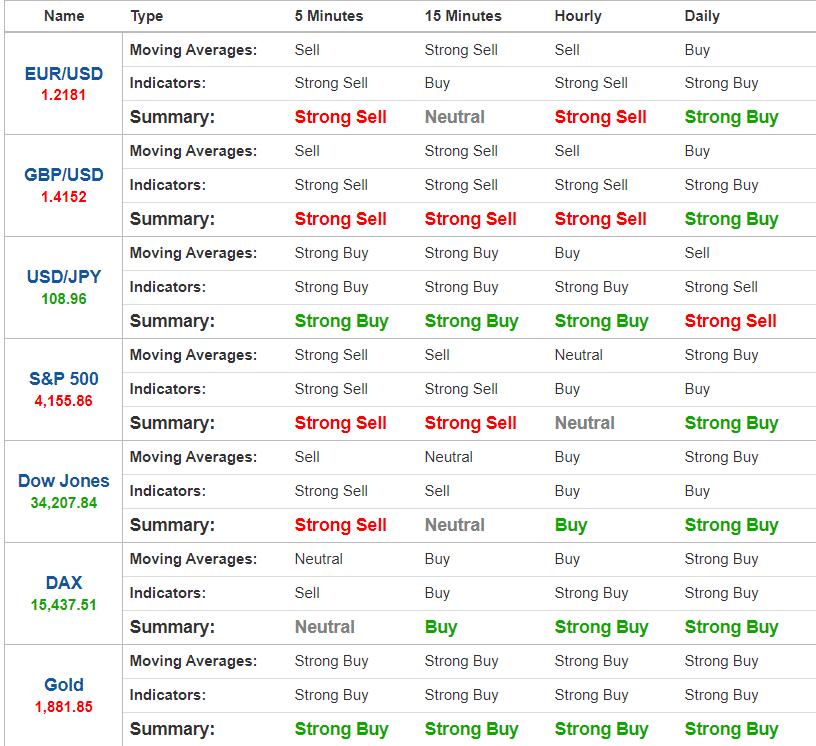
As a day trader, we recommend using the concepts of pivot points in your trading because they work. In addition to these, the website provides an automated summary of what technical indicators are signaling, as shown below. Still, while using the tool is good, we recommend that you conduct technical analysis yourself.
Investing.com technical summary
News and insights
As a forex trader, having access to fast and quality information can help you improve your trading results. This is one of the reasons why many investors are always willing to pay some money to get the information. Investing.com has a well-customized news platform.
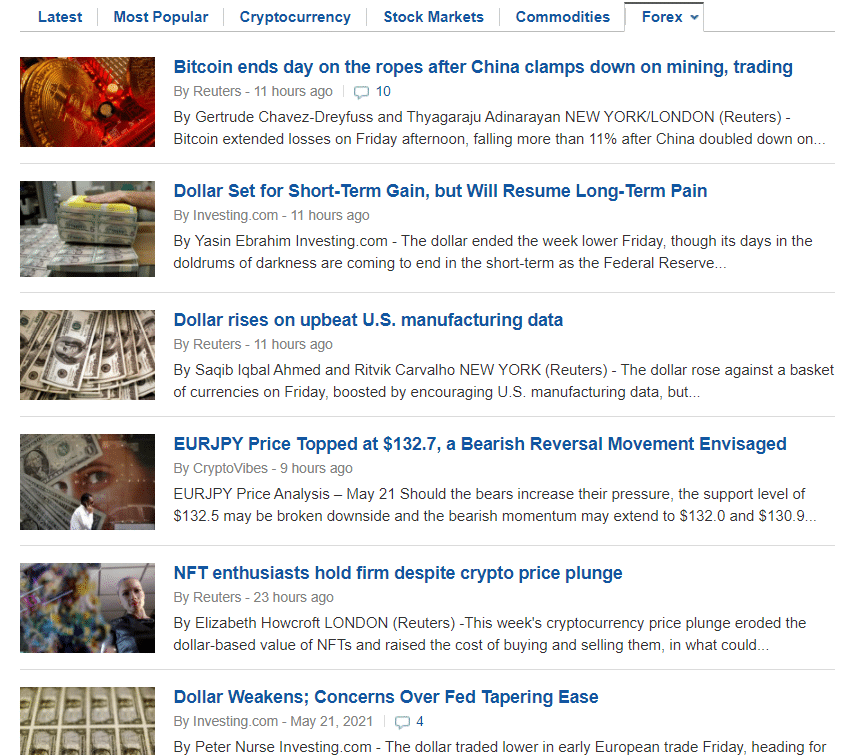
As shown below, you can customize the news you want to view by selecting stocks, forex, cryptocurrencies, and indices, among others. The company has a team of employees focused on various assets. It also provides up-to-date news from popular platforms like Bloomberg and Reuters.
Investing.com news
Final thoughts
As a forex trader, having good data to help you with technical and fundamental analysis is an advantage. Investing.com is a free platform that gives you these two. It has features that help you to do all types of analysis. Other things you need to do as a nimble forex trader are downloading the mobile applications, having a free or premium account, and visiting the site every day.,

