Ichimoku Cloud, also known as Ichimoku Kinko Hyo, is a popular – and often scary – indicator. It helps traders identify breakouts and support and resistance levels.
It was developed by Goichi Hosoda, a Japanese trader, in 1969 and is one of the default trend indicators found in MT4, MT5, and other trading platforms. Although it might seem scary at first, it is actually a straightforward indicator developed using several simple strategies.
The Ichimoku Cloud has five essential parts, as shown in the chart below (figure 1). The red line is known as the Tenkan-sen and is usually the conversion of the indicator.
The blue line is the Kijun-sen (baseline of the system), while the green line is the Chikou-span or lagging span. Meanwhile, the white cloud is the Up or bullish kumo, while the purple cloud is the down or bearish kumo.
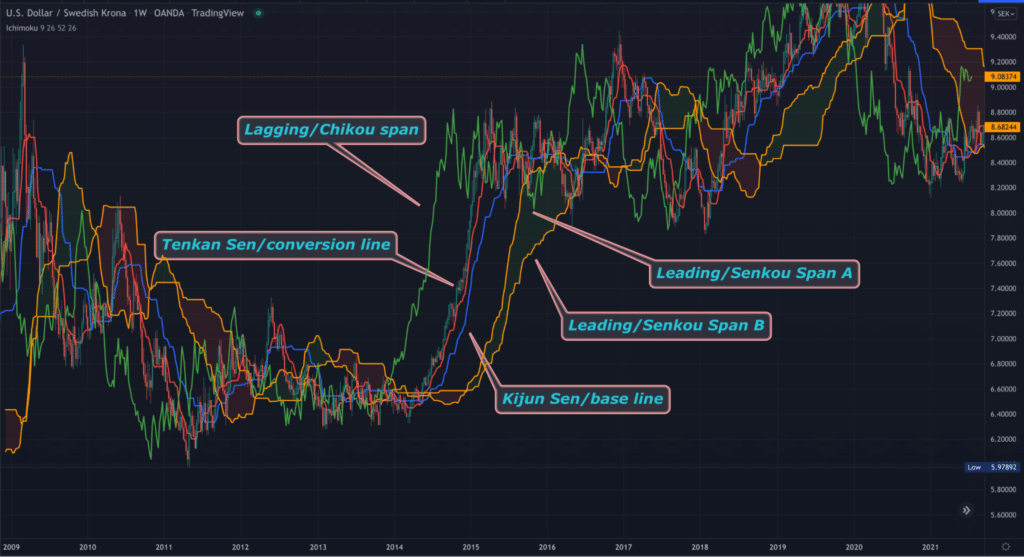
Traders use the Ichimoku Cloud to do several things. First, the indicator confirms the strength of a bullish or bearish trend. Second, traders use it to identify when a breakout is about to happen.
Third, traders use it in combination with other indicators to confirm breakouts and reversals. Finally, some traders use the Ichimoku Cloud to identify support and resistance levels.
How the Ichimoku Cloud is calculated
Like all indicators, the Ichimoku is calculated using a combination of several mathematical calculations. While understanding these calculations is important, it is not necessary as a trader.
Instead, you should focus on applying the indicator and interpreting it in the market.
- Kijun-sen, also known as the baseline, is calculated by adding the period’s high and the period’s low and then dividing the figure by 2. In most trading platforms, the default setting is usually 26, but you can adjust it to suit your trading style.
- Tenkan-sen, also known as the conversion line, is calculated by adding a shorter period’s high and low and dividing it by two. In most platforms, the shorter period is usually 9.
- Senkou Span A is calculated by adding the conversion line (Tenkan-sen) with the baseline (Kijun-sen) and dividing the answer by 2.
- Senkou Span B is calculated by adding the 52-period high and the 52-period low and dividing the result by 2.
- Chikou Span, also known as the lagging span, is a line that represents the current candle closes but several periods in the past.
- Finally, the Kumo or cloud is formed by the extremes of Senkou Span A and Senkou Span B.
How to interpret the Ichimoku Cloud
The cloud is the most critical aspect of the Ichimoku trading system. The price of an asset is usually bullish when it is above the price is above the cloud and bearish when it is below the cloud. When the price is in consolidation, it is usually inside the cloud.
This is not all. The bullish trend is strengthened when the price is above the cloud and when the leading (Senkou) span A is rising above the leading (Senkou) span B.
Similarly, the bearish trend is usually made strong when the leading span A falls below the leading span B. The two scenarios are what produce the green and red clouds.
How to trade with Ichimoku Cloud
Let’s now explore a few strategies to generate signals for Ichimoku Cloud day trading and more.
Strategy 1
As already mentioned, one of the primary purposes of this indicator is identifying existing trends and early signs of when they change. Experts observe the behavior of the base/blue and conversion/red lines. When the blue line goes above the red line, it’s an early sign of a potential bullish move.
On the other hand, when the baseline goes above the conversion line, it’s an early trigger of a potential bearish move. The last puzzle piece is watching for the price to break the cloud.
When the crossover remains intact with the market above the cloud, it adds extra weight to the trade. Traders can use this crossover as an exit trigger when in a profitable position.
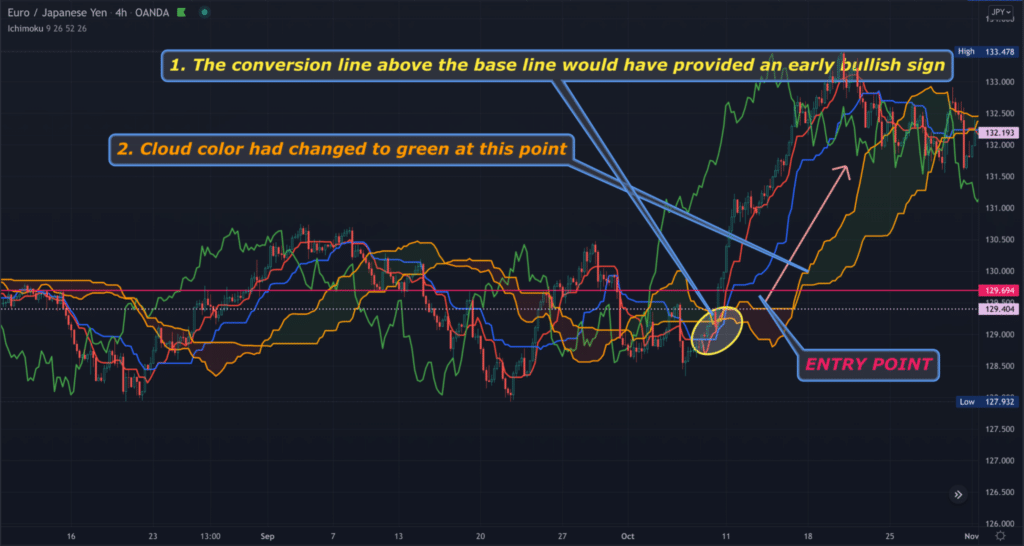
The chart above demonstrates a recent buying signal on EURJPY (figure 2). A trader would have entered the position near the yellow ellipse marked ‘ENTRY POINT.’
Strategy 2
Any trading platform you use should allow you to remove all the lines and only leave the cloud.
With this strategy, traders can employ what is known as the ‘kumo twist,’ which is when the leading span A and leading span B cross, changing the cloud’s color.
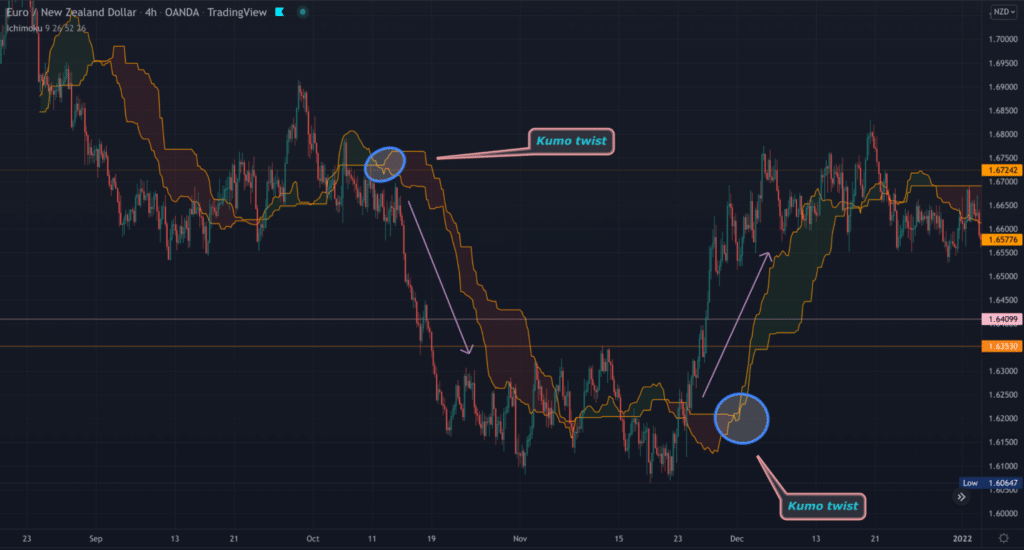
Traders consider this a reasonably potent reversal signal. In the EURNZD chart above, we’ve used an ellipse to circle two instances of the kumo twist. Note how price reverses (figure 3).
Ichimoku Cloud best time frame
There isn’t necessarily the best time frame to use the Ichimoku Cloud, as with any indicator. It all boils down to your inherent trading style and what you look for in the markets.
Generally, the lower the time frame, the more Ichimoku Cloud signals to expect. However, the depth of movements will also be less pronounced, although this is sufficient for short-term traders like scalpers who frequently look for a few pips in profit.
Also, like any other indicator, the cloud will look ‘noisier’ on lower charts. Conversely, the higher the time frame you go, the more reliable the Ichimoku Cloud becomes. Yet, you should expect fewer signals with the tool.
However, the movement depth would be far more significant in certain conditions, which is preferable for long-term swing and position traders who emphasize quality over quantity.
What also matters is the currencies the cloud is applied to. Markets with a naturally larger range movement, particularly GBP-based pairs, will produce different types of clouds compared to less volatile instruments.
Ichimoku Cloud buy and sell signals
To make things simpler, we’ve outlined below the main factors to observe in formulating a buy and sell signal, respectively.
Buy signal:
- The price must be above the cloud, which would have turned into a green shade
- The conversion/red line should be above the base/blue line
Sell signal:
- The price must be under the cloud, which would have turned into a red shade
- The base/blue line should be above the conversion/red line
Is Ichimoku Cloud strategy good?
One frequently cited and understandable limitation of this indicator is how it can make one’s charts appear cluttered. Fortunately, most charting platforms should allow users to remove any lines they wish.
The significant lines for most are the base and conversion lines, along with the cloud. Another drawback worth noting, prevalent in all indicators, is the lagging nature of the Ichimoku.
However, on the plus side, this indicator is like the ‘jacked up’ version of Moving Averages. It helps analysts identify trends but in a more advanced way.
One distinct feature is how the lines attempt to project future support and resistance levels, unlike most indicators relying primarily on past data.
So, overall, any strategy involving this tool is excellent. However, as with any indicator, it’s always best to combine it with something else.
Trend signals when using the Ichimoku cloud
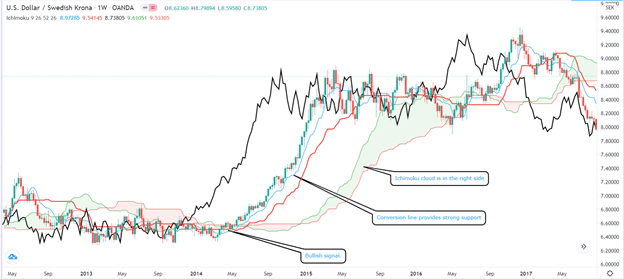
When using the Ichimoku cloud, a bullish signal comes out when two things happen. First, it happens when there is a crossover of the conversion line and the baseline. When this happens, it usually leads to a cloud pattern, which tends to be below the price. The price will often remain to be bullish so long as the price is above the conversion line, which is usually the support line. Also, it will remain to be bullish so long as Lead 2 is on the left side of lead 1.
The weekly chart below shows a good example of the Ichimoku cloud at work.
Bullish Ichimoku cloud signal
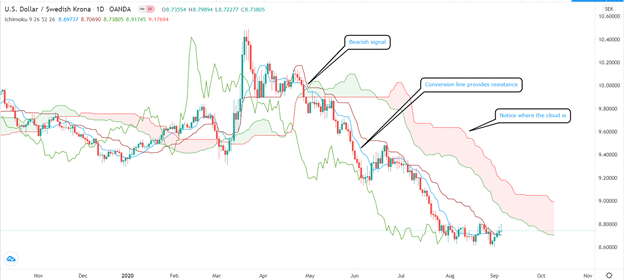
Similarly, a bearish signal emerges when the price of an asset is in a bullish trend. As the trend continues, the signal happens when the conversion line and the baseline make a bearish reversal. As the price drops, the conversion line usually creates an important resistance. A good example of this is shown in the daily USD/SEK pair shown below.
USD/SEK bearish signal using Ichimoku cloud
The Ichimoku cloud produces other signals. A common one is known as the Kijun bounce. This is a situation where the price moves to the Kijun-sen and then rises. This scenario usually happens when the price of an asset is trending very aggressively as it moves away from the equilibrium. It retests the Kijun-sen to establish the equilibrium again.
Another signal is known as the TK cross. This is when the Tenkan-sen crosses the Kijun sen. In some cases, this is usually seen as a bullish signal. However, you need to look at whether the cross is in sync with the cloud and the price.
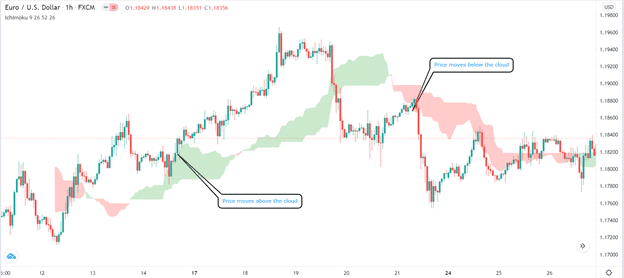
Finally, a popular Ichimoku cloud strategy involves removing all the lines and remaining with just the clouds. In this approach, your goal is to see where the price is in relation to the cloud. As a result, if the price of an asset is rising, you can confirm a trend when the price moves above the cloud. Similarly, if the price is falling, you can confirm the strength of the trend if it moves below the cloud. A good example of this is in the hourly EUR/USD chart below.
As you can see, the price continued to rise when it moved above the Ichimoku cloud. Similarly, a bearish signal happened when the price moved below the cloud.
Example of a plain Ichimoku cloud
Another Ichimoku trading strategy is the Kumo twist, which happens when the Senkou span A and Senkou span B crosses. This is usually a sign that a reversal could happen in the near term. Other signals are C-clamp, edge-to-edge, and kumo breakout.
Final thoughts
The Ichimoku Cloud is a trend indicator that often shocks new traders because of its appearance. It does not take long to learn how to use Ichimoku Cloud.
A simple rule is that bullish signals emerge when the price moves above the cloud, when the cloud changes color, and when the price moves above the baseline. In this case, the conversion line is usually the support.
On the other hand, a bearish signal emerges when the price moves the cloud, when the cloud changes color, and when the price moves below the baseline. Still, like all indicators, the Ichimoku is not always accurate.
As a result, it is always important to combine it with other indicators like the RSI and MACD and other tools like the Fibonacci retracement.

