
When the trend is clear, if a breakthrough occurs above the upper envelope, it is an indication of a solid trend, and it tells you that the bullish trend will probably persist. When there is a downtrend, and a breakthrough takes place beneath the lower envelope, it may be considered as a sign that the trend will persist in the same direction.

A long trade should be entered when the price line intersects the upper band, and the stop loss should be placed beneath the moving average line. A trader should exit their position if the price’s closing point lies beneath the MA line.
On the other hand, a short trade should be placed when the price line intersects the lower band, and in this case, the stop loss should be situated above the MA line. Such a position should be exited whenever the price exceeds the level of the moving average.
- Keltner and Bollinger Bands
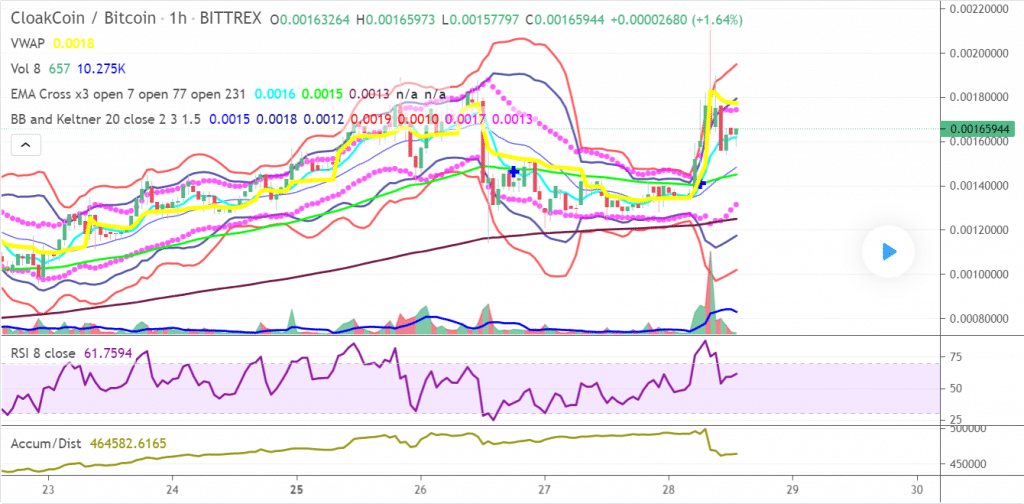
While both Bollinger Bands and Keltner Channels show the squeeze event, the latter is tighter in contrast. For Bollinger Bands, the contractions and expansions are more visible and wider in comparison to Keltner Channels. In this trading scheme, the indicators are merged to provide corroboration of the volatility reversing and the Bollinger Band breaking out.
Before considering making a market entry, you need to ensure the market is not too volatile and that the price is consolidated. When both of the Bollinger Bands enter the Keltner Channel, a squeeze is said to have taken place. This tells you that the volatility may rise very soon.
After the confirmation of the squeeze, if a price breakout occurs from the upper band, it tells you that a bullish trend might be approaching. Conversely, if the breakout occurs from the lower band following a squeeze, it gives you an indication of a bearish trend approaching.
As a general rule, you should enter long when the upper Bollinger Band is less than the upper Keltner channel, and the lower Bollinger band is greater than the lower Keltner channel and the closing price exceeds the upper BB. A short trade should be initiated when the converse occurs, with the closing price being less than the lower BB.
- Volatility Bands
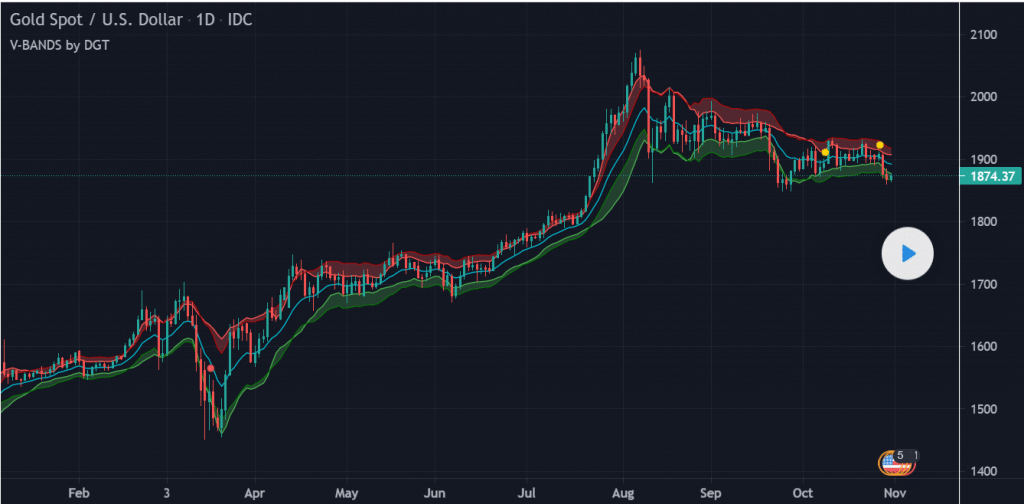
In this trading scheme, volatility bands are used to compute and envisage the volatility with the aid of the average true range (ATR) indicator and standard deviations. This will help you identify profitable trading occasions.
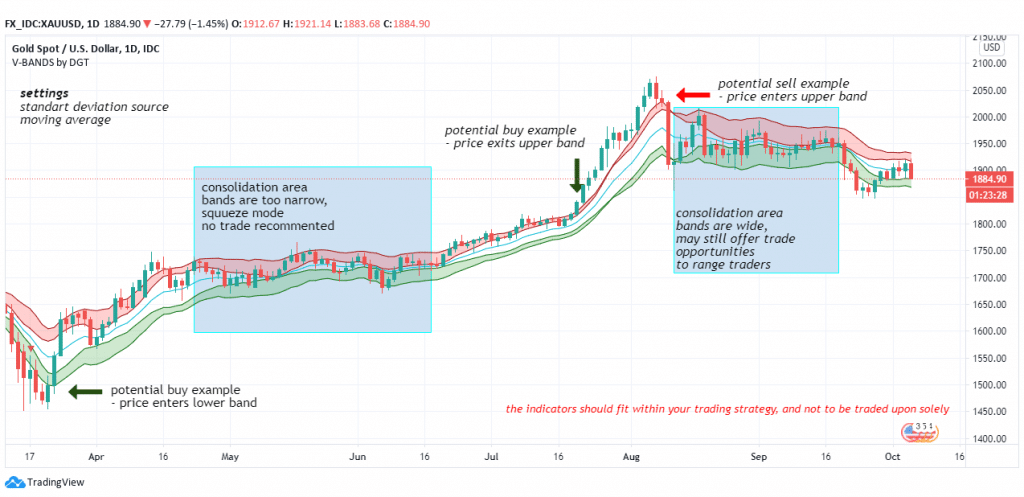
As you can see in the picture above, trading is not recommended when the bands in the consolidation areas are too narrow. When they are wide, however, range traders can find several trading occasions. The default settings for this scheme are one standard deviation, a 13-period exponential moving average, and a one-time average true range above and below the EMA.
When the market is consolidating, the bands depict overbought and oversold zones. They will also act as entry and exit points once the price action exits the bands when the market is trending. When there is a bullish trend, you should go long when the price action exits the bands and go short when it enters the bands.
When there is a bearish trend, you should go short when the price action exits the bands and go long when it enters them. You can also use other indicators apart from the ones mentioned.
- MA crossover
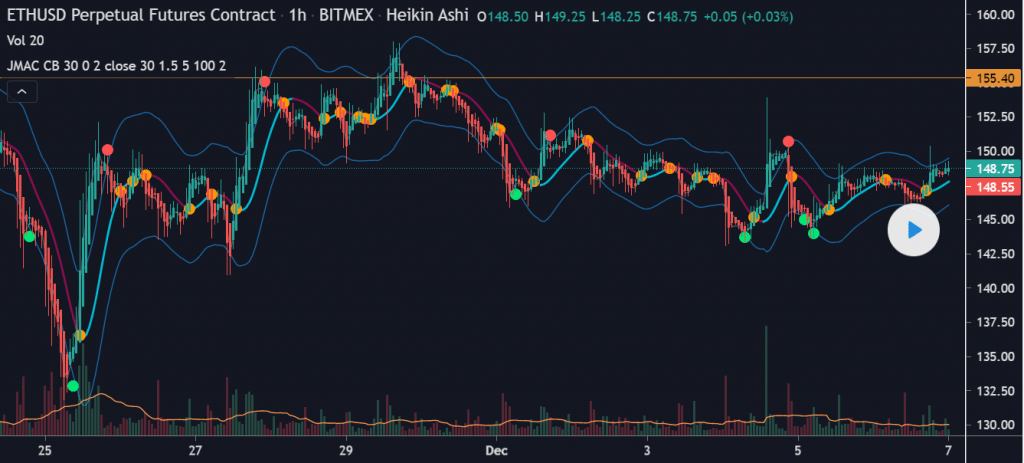
When the market tends to reverse frequently in a trading range, it is difficult to use the MA crossover strategy. There is a lag between the trade signal generated by the moving average and the actual instance when the market changes direction. Keltner Channels present a better option in such an environment.
Here a channel is created based on resistance and support, and when the price breaks out of this channel and does not maintain the momentum, it will likely return toward the center.
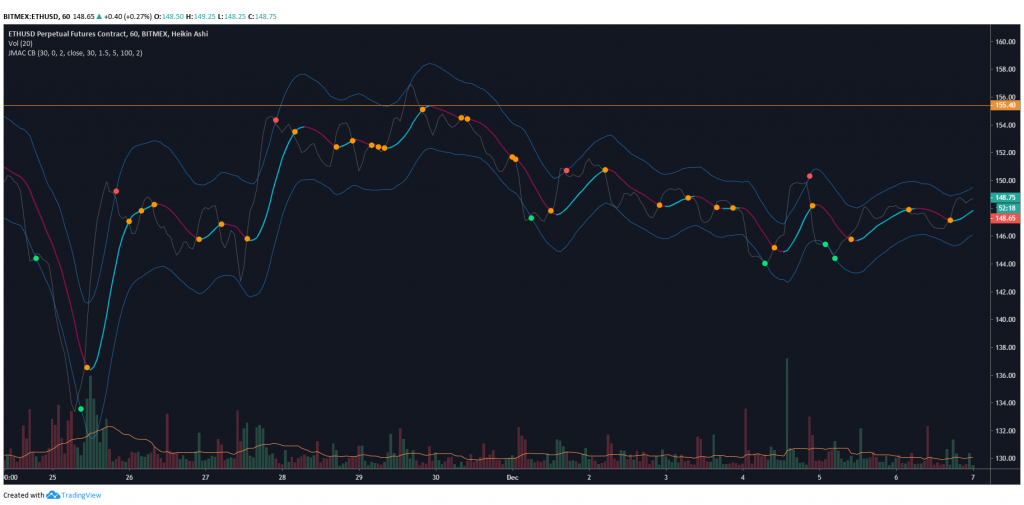
Consider the above scenario where the maroon and blue lines constitute the channel. The red dots show that the price is returning to the channel and the market is reversing from a failed upward breakout, while the green dots indicate when the price reverses from a failed downward breakout. These are good points for making trade entries.
The price crossing the centerline is indicated by the orange dots, which is a decent take profit and trade exit point.
- Keltner Channel + EMA
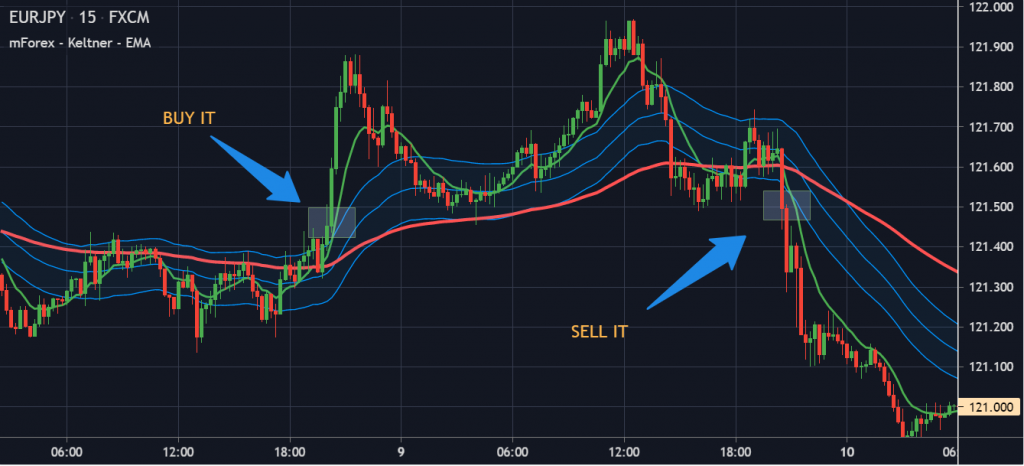
This strategy can be used for GBP/USD and EUR/USD pairs for trading in the M5 and M15 timeframes during the London and USA trading hours. You should enter a long trade when the candle closes on the upper Keltner, and the 10-period Exponential Moving Average crosses the upper Keltner range from below. The stop loss should be up to 12 pips or in the middle band, and the profit target should be 15-25 pips.
A short trade should be initiated when the candles close beneath the lower Keltner, and the 10-period EMA intersects the lower Keltner range from above. The stop loss should be up to 12 pips or in the middle band when the profit target should lie between 15 to 25 pips.
- Bollinger Bands Keltner Breakout
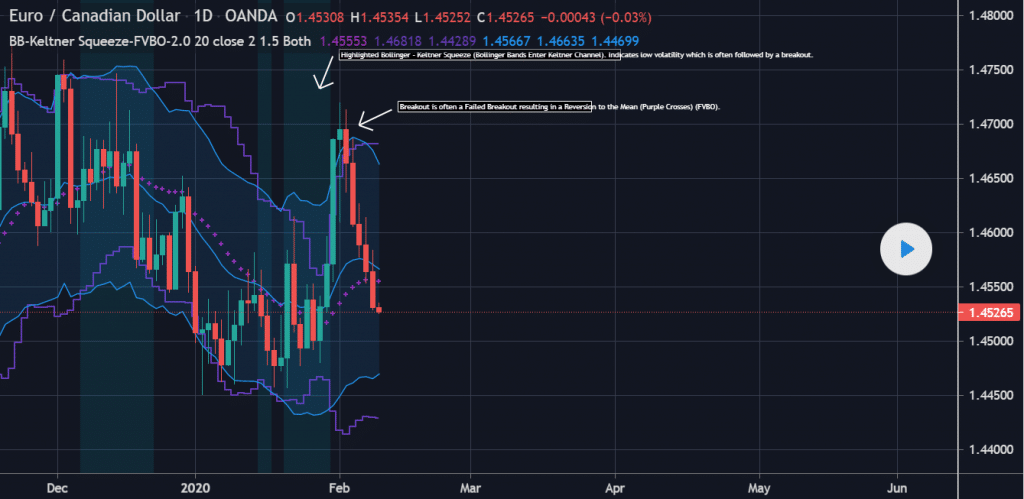
This strategy should be used when both the BBs remain within the Keltner Channels. After the formation of the squeeze, you need to stand by for the upper BB to intersect the upper KC and advance upwards and for the price line to cross the upper band for entering a long trade. For a sell trade, you should stand by for the lower BB to intersect the lower KC and move downward, waiting for the price line breaking the lower band.
Summing up
Some of the similarities between these chart situations are:
- They signal the beginning and end of a trend.
- They help identify oversold and overbought levels.
- They can be used for anticipating reversals.

